BASIC REPORTING PART VII: Formatting Your Report (Optional)
- After you finish drafting and verifying/troubleshooting your report, it is time to format the report - to adjust the presentation of the report to make it "pretty" and/or easier to read.
- There are many options for formatting your reports. Formatting refers to the process of adjusting the appearance of the report by adjusting the stylistic elements of the report, rather than manipulating the data that appears on the report (which is covered in Part V of our basic reporting tutorials).
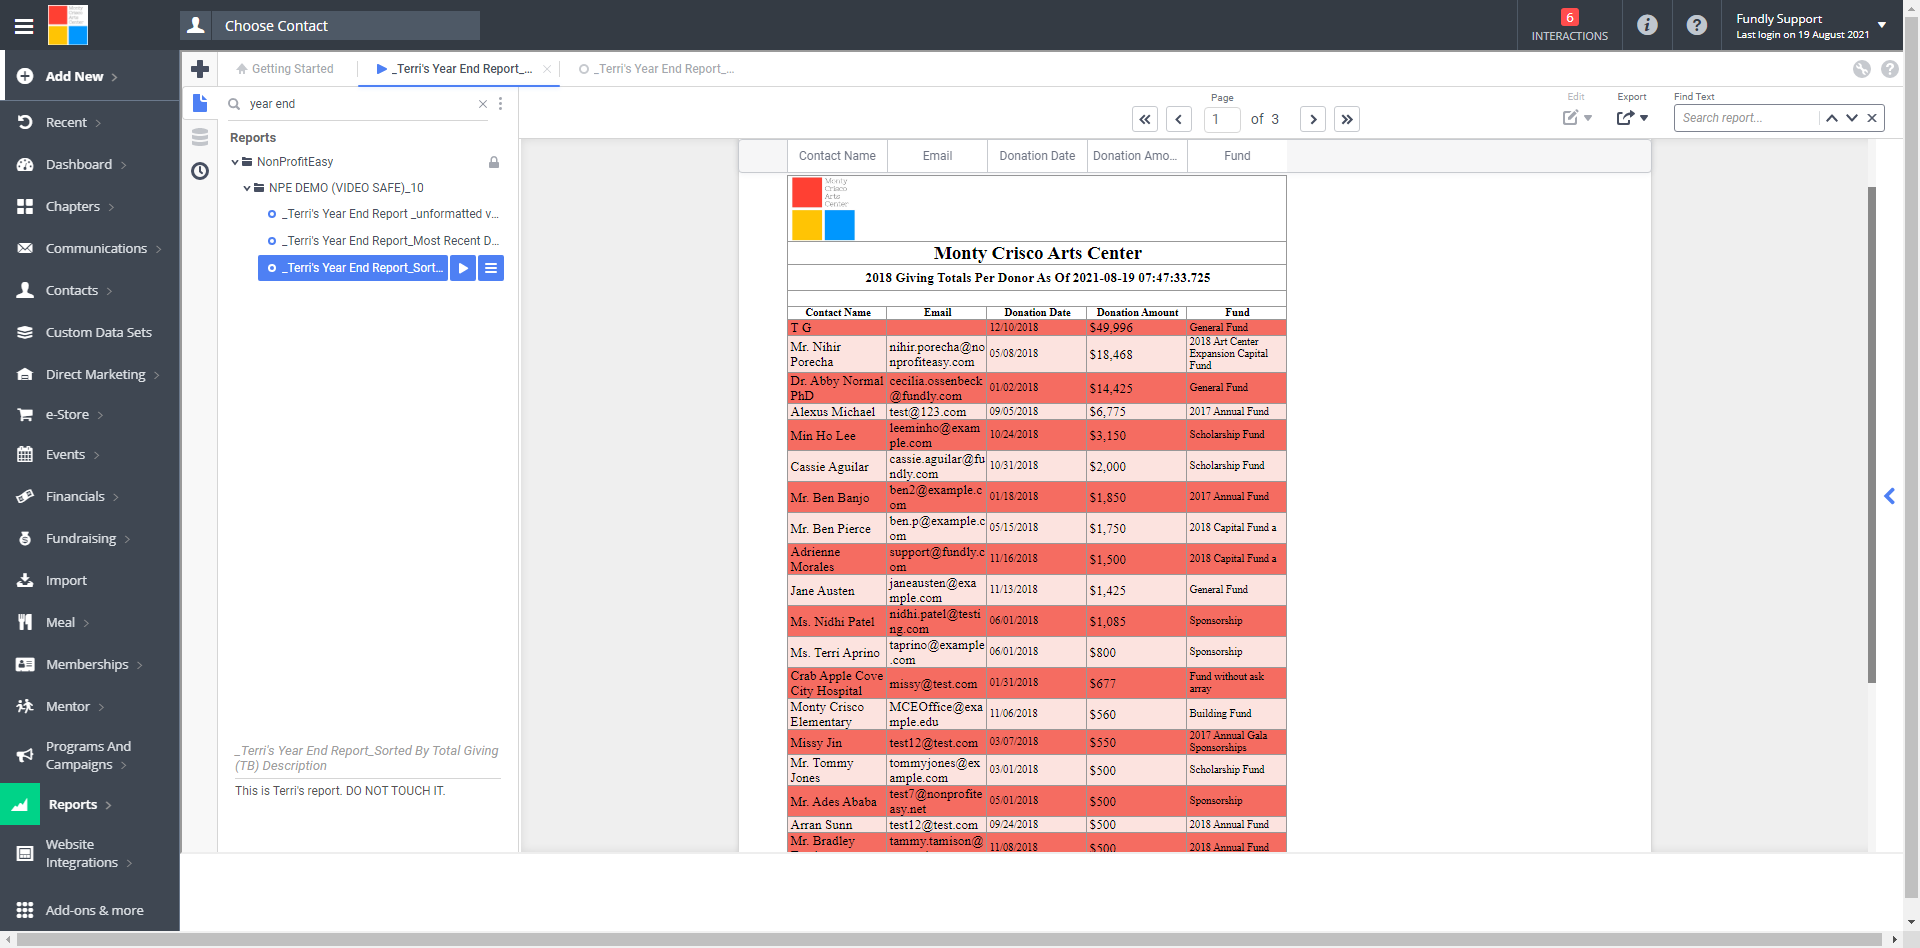
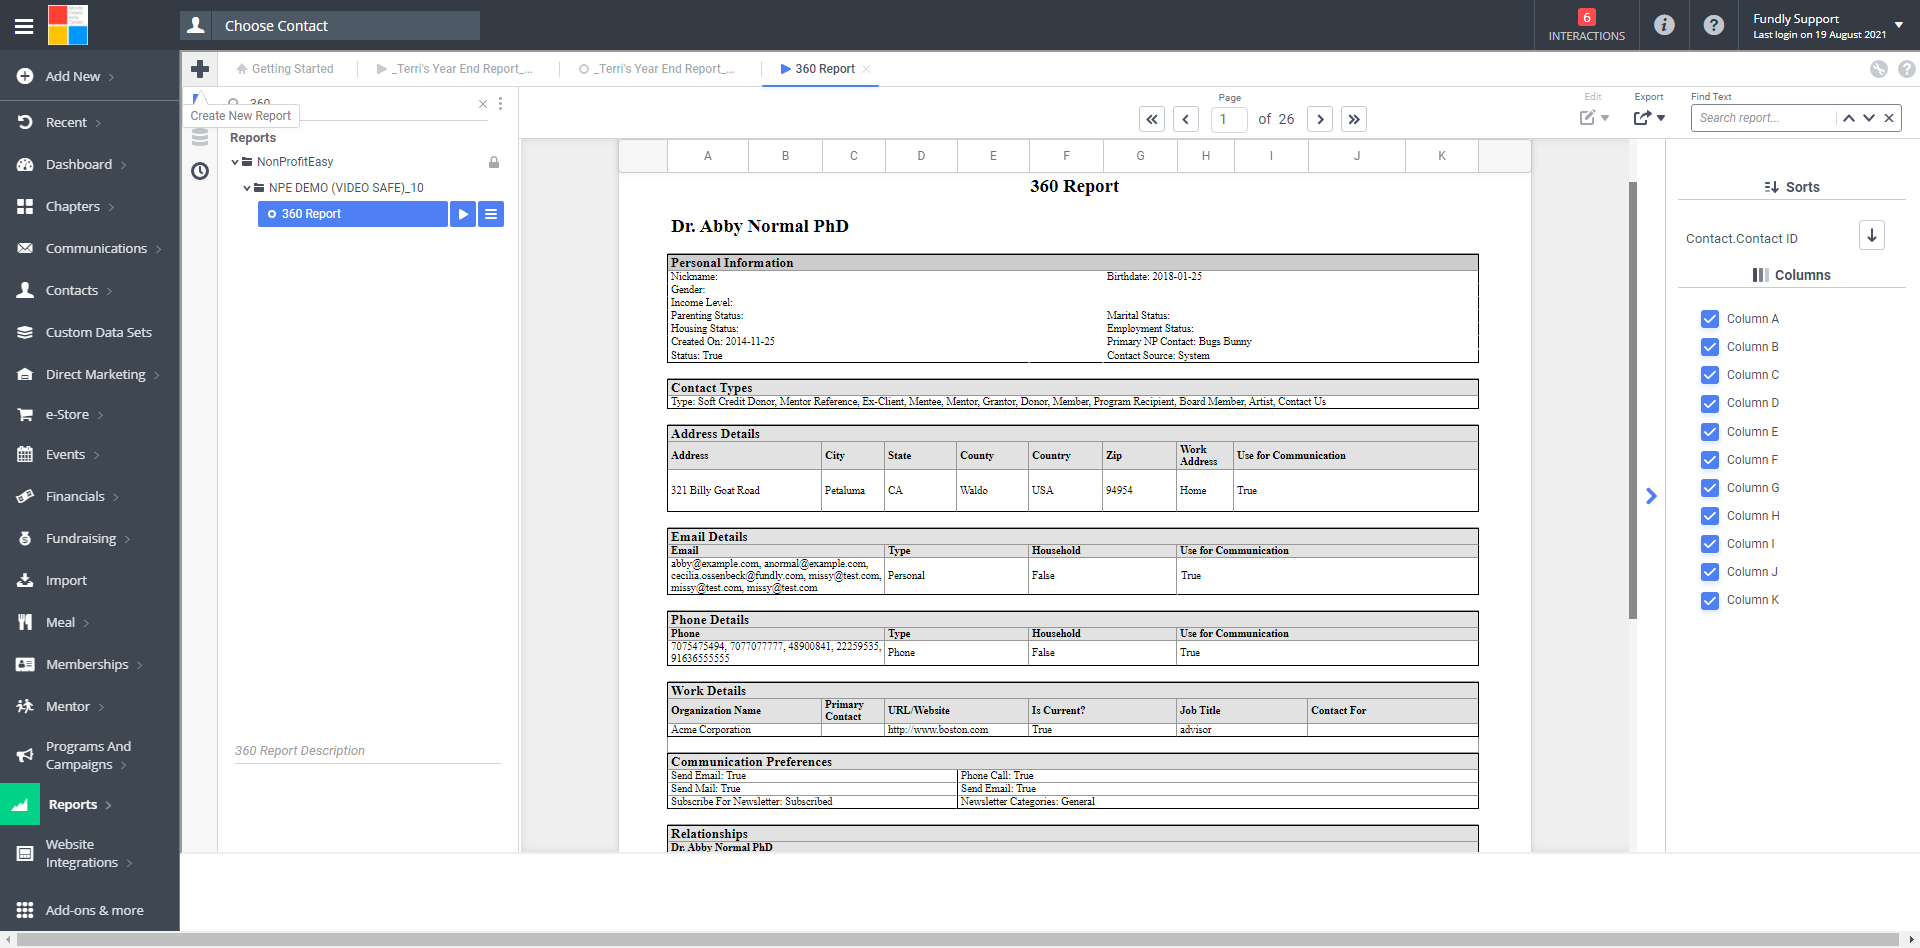
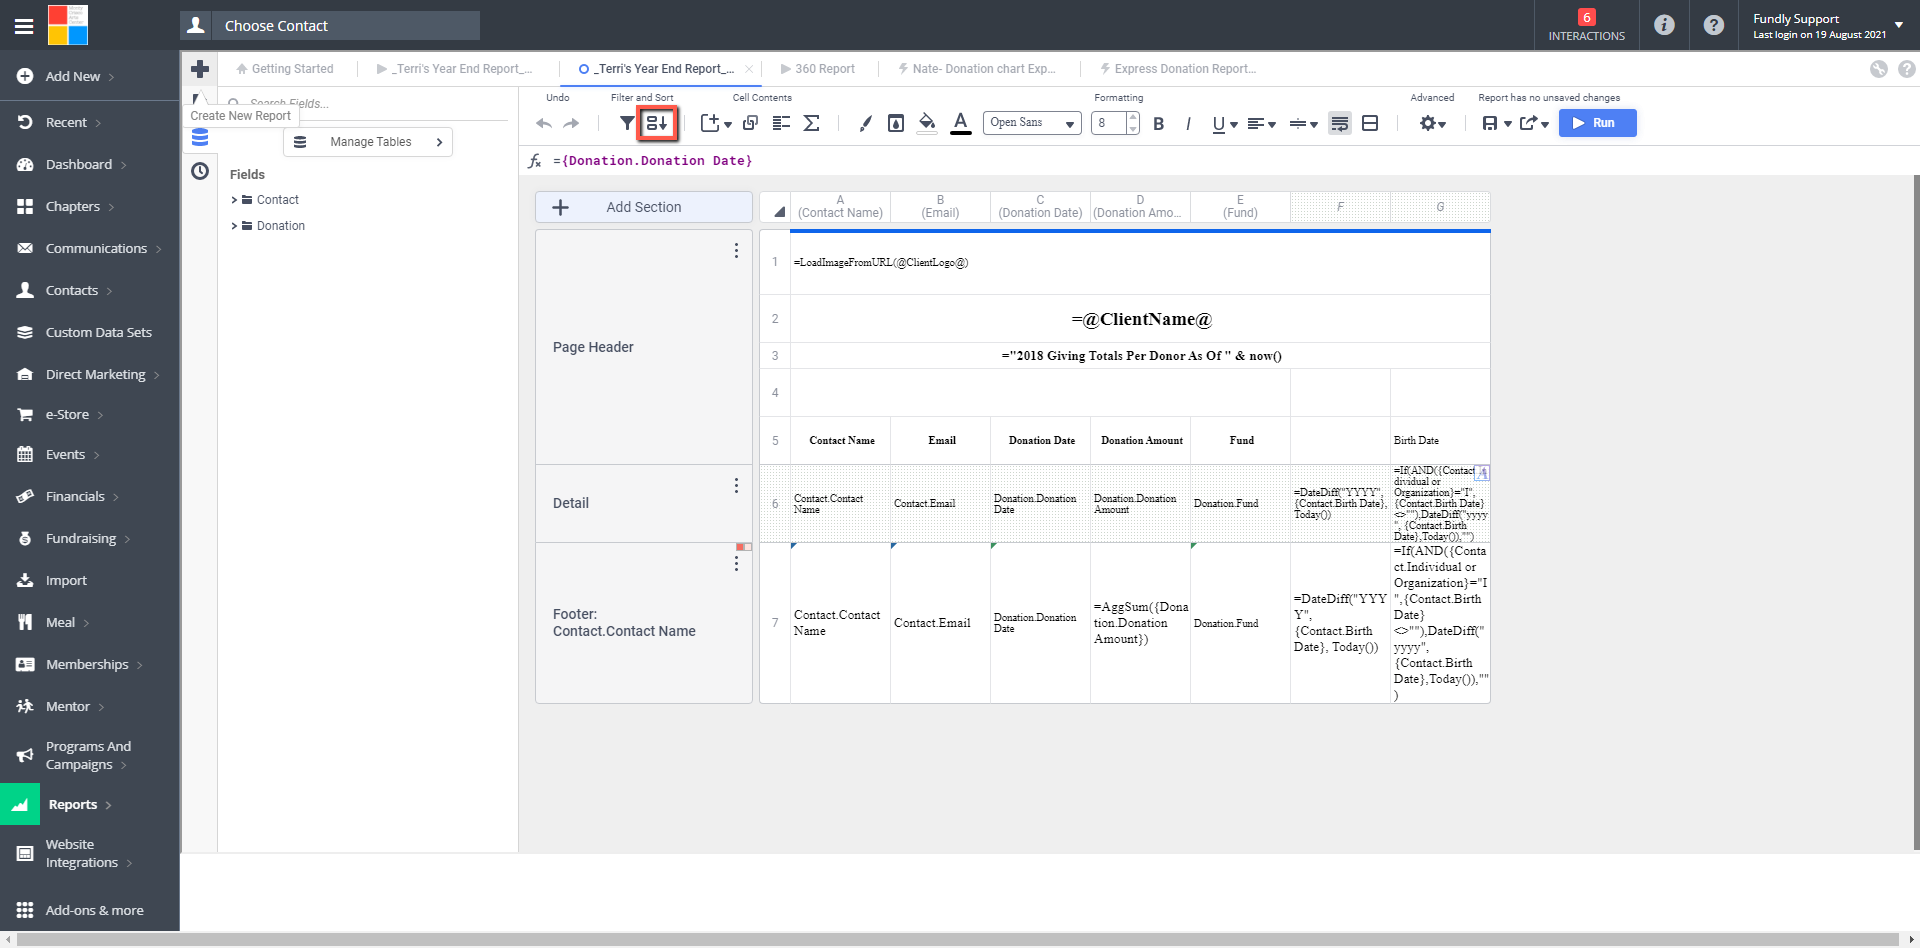
- Here are a couple of examples of reports that has been formatted with various formatting options that make it easier to read or more attractive. The top one has the organization's logo dropped in, a bolded and centered header (across multiple/merged cells), and alternate row shading. The second one has border and background shading as well as horizontal and vertical alignment/layout and repeating groups to help set off/delineate the different types of information on the report.
- Your instinct may be to export the data to Excel and then adjust the formatting there, but that will always take longer because you will then HAVE to export to format and, additionally, you will have to manually adjust the formatting every single time you export the data. Rather, it's better to set up the formatting you want in your report so that every time you run the report it, it's already formatted. Taking a few minutes to get the formatting set up the way you want inside the reports module will save you time in the long run since you will only have to set up the formatting once and then it will be saved permanently.
- The formatting options presented in this tutorial apply to custom reports. You cannot adjust the appearance of default reports (though you can copy them to your custom reports folder and then edit the copy) or any of the system exports (financial export, search results export, smart dashboard export, event attendee export) from within the system (you can only adjust the appearance from within MS Excel after you export the data).
- You can control the report formatting by adding columns and rows, merging cells, and splitting cells.
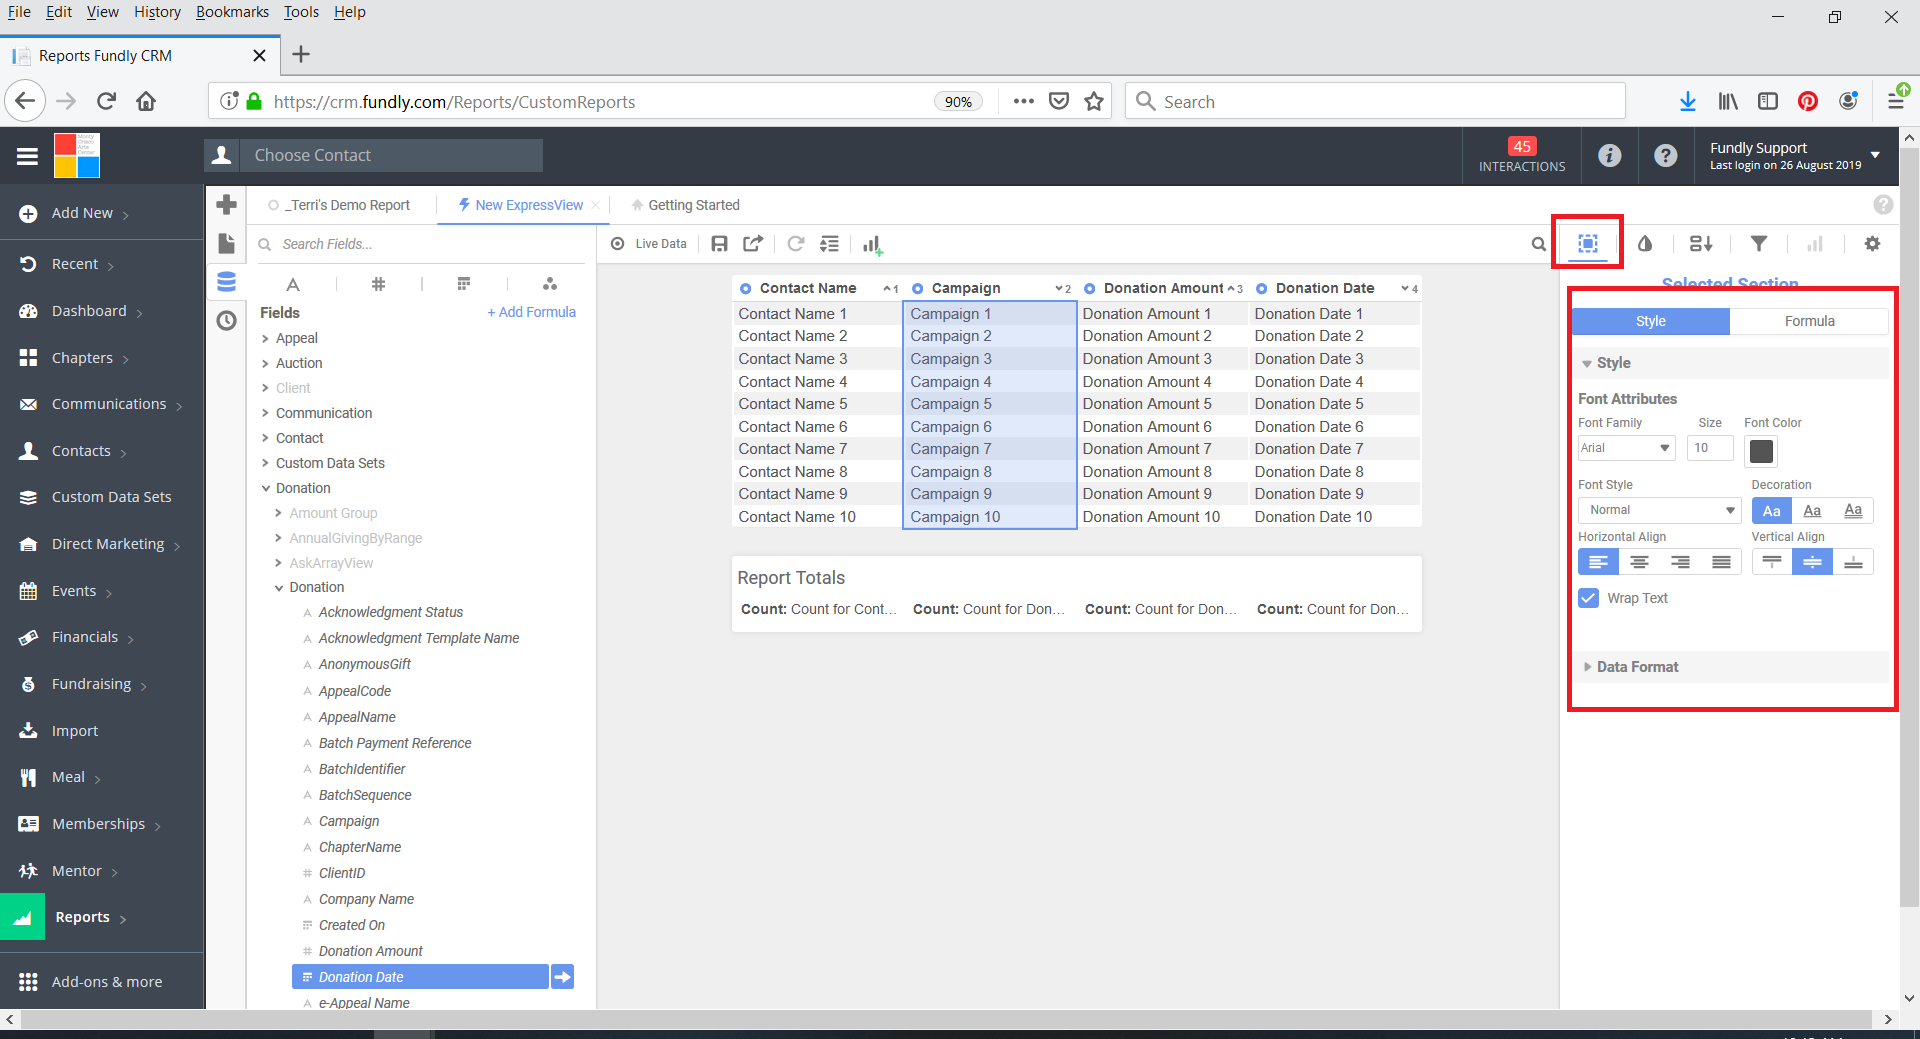
- In the Express View interface, you can add columns by clicking the Add Formula link in the upper left of the field list (top screen show below); however, you cannot merge cells or add rows.
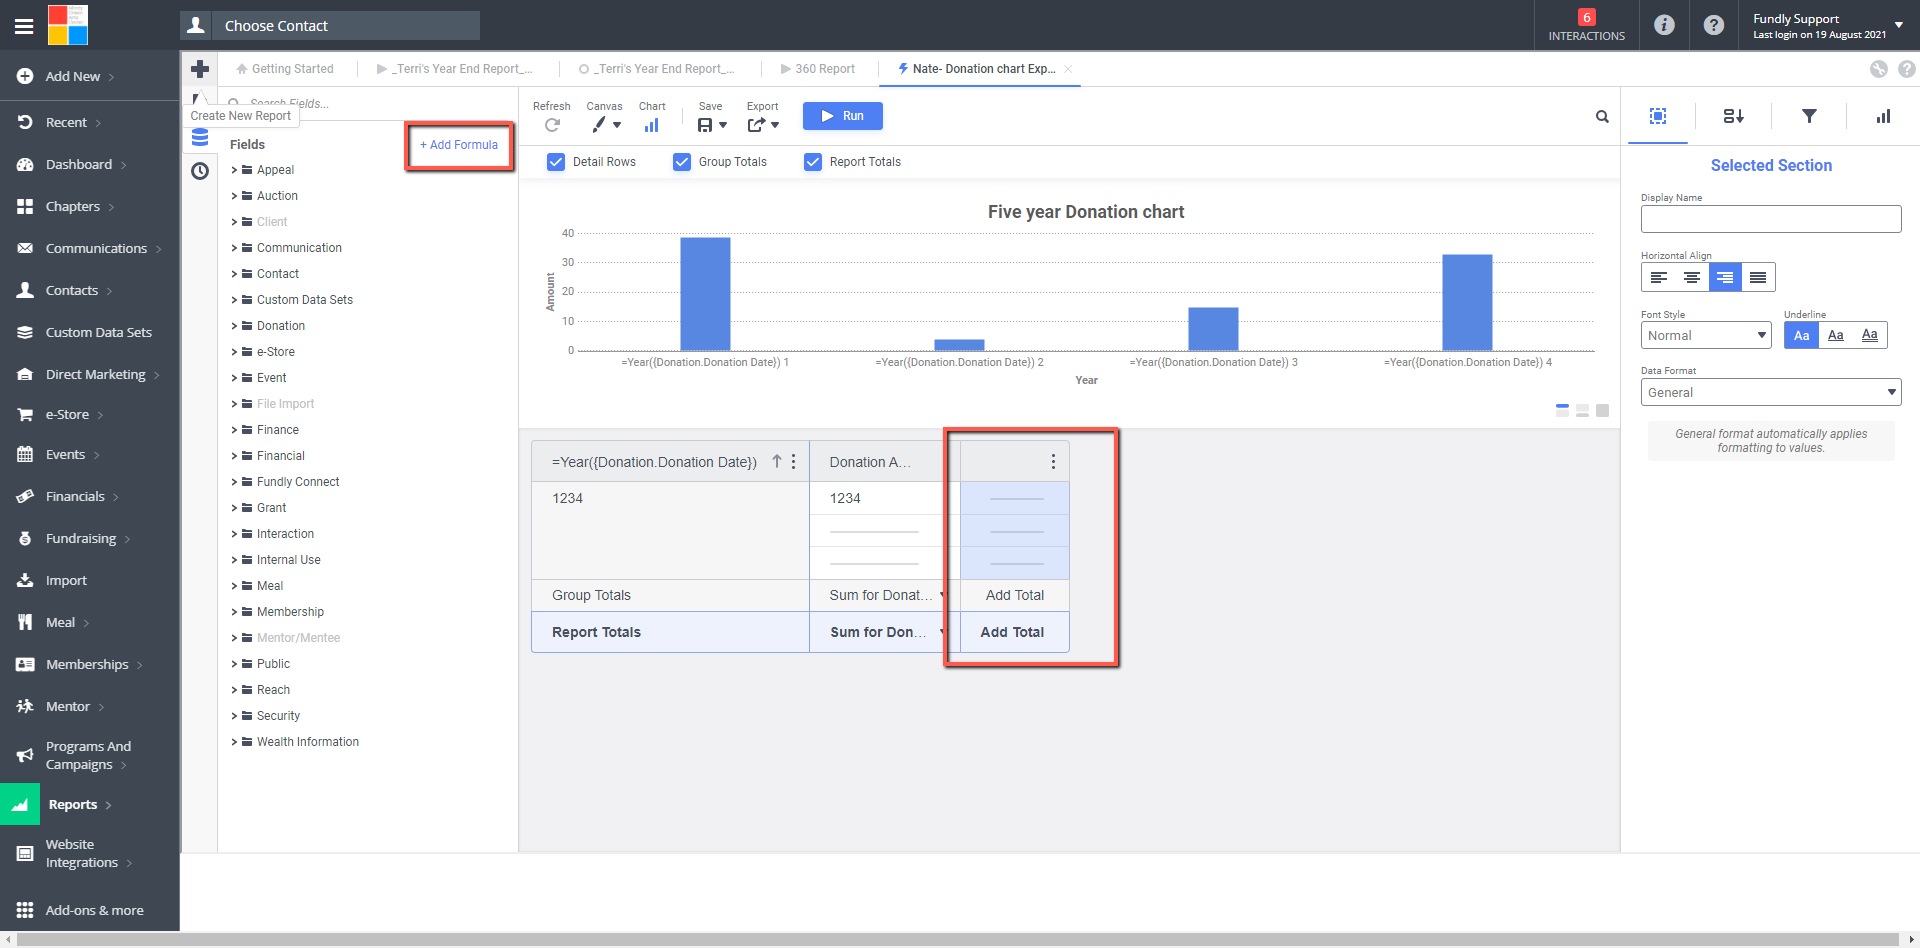
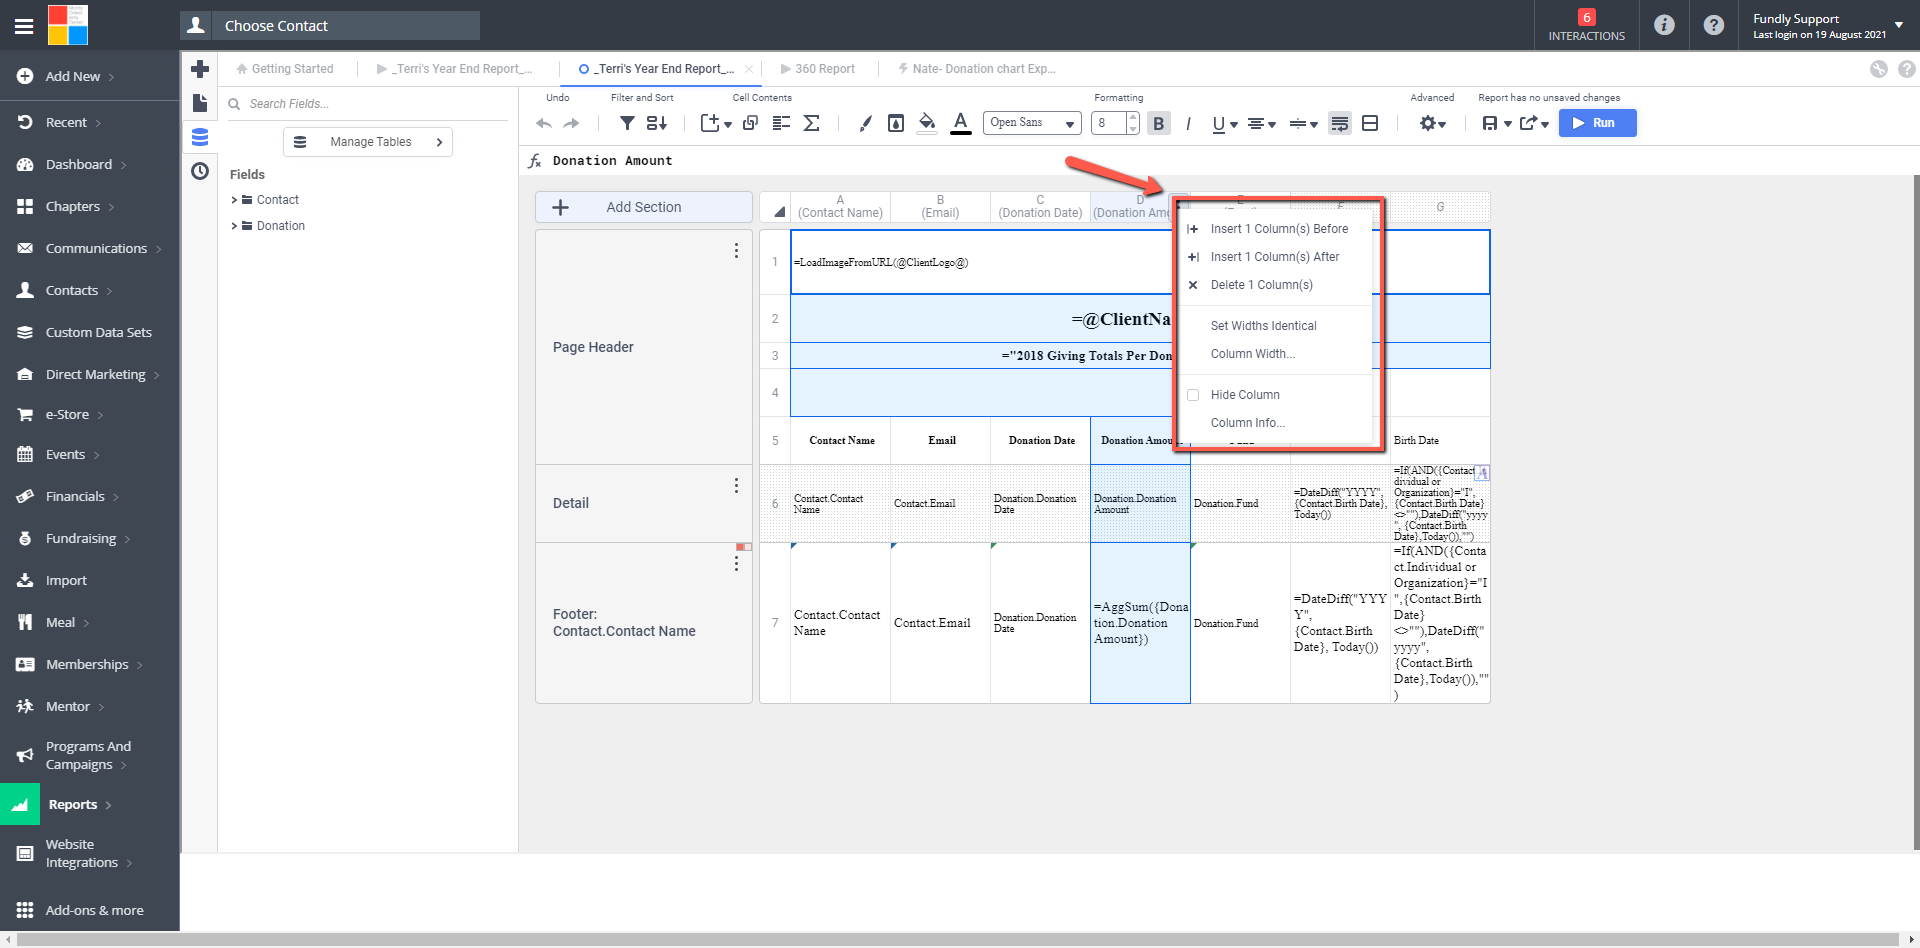
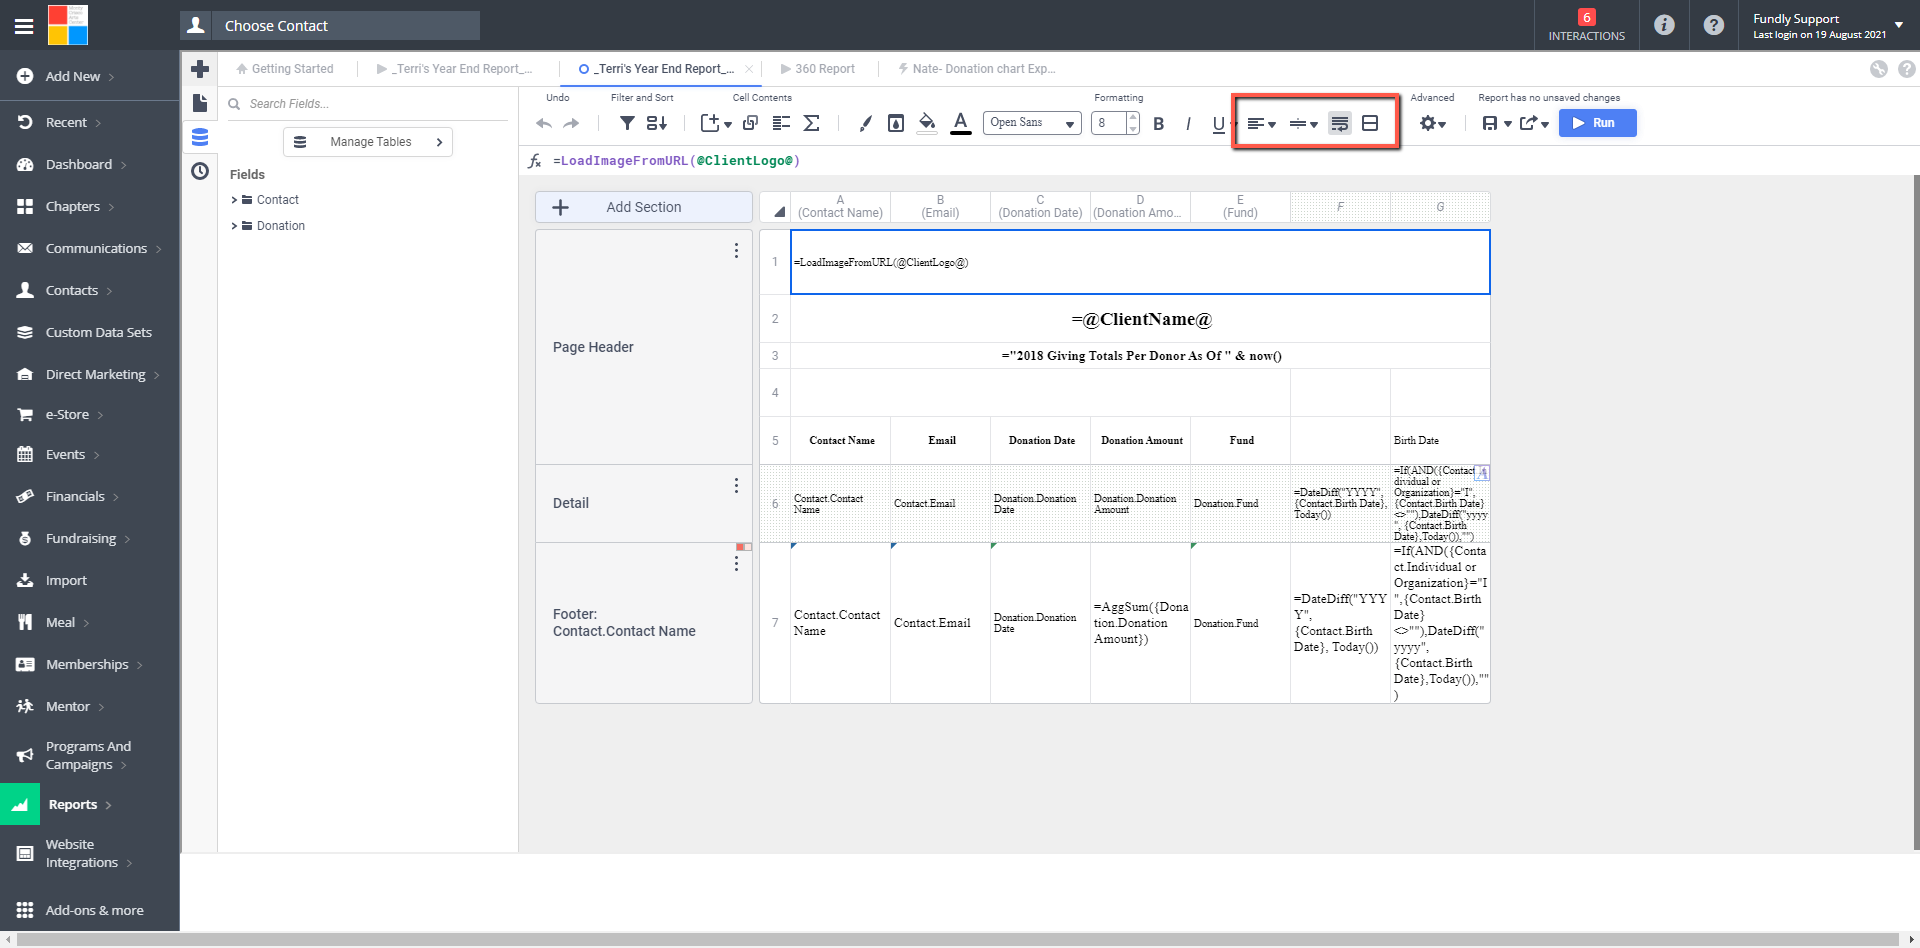
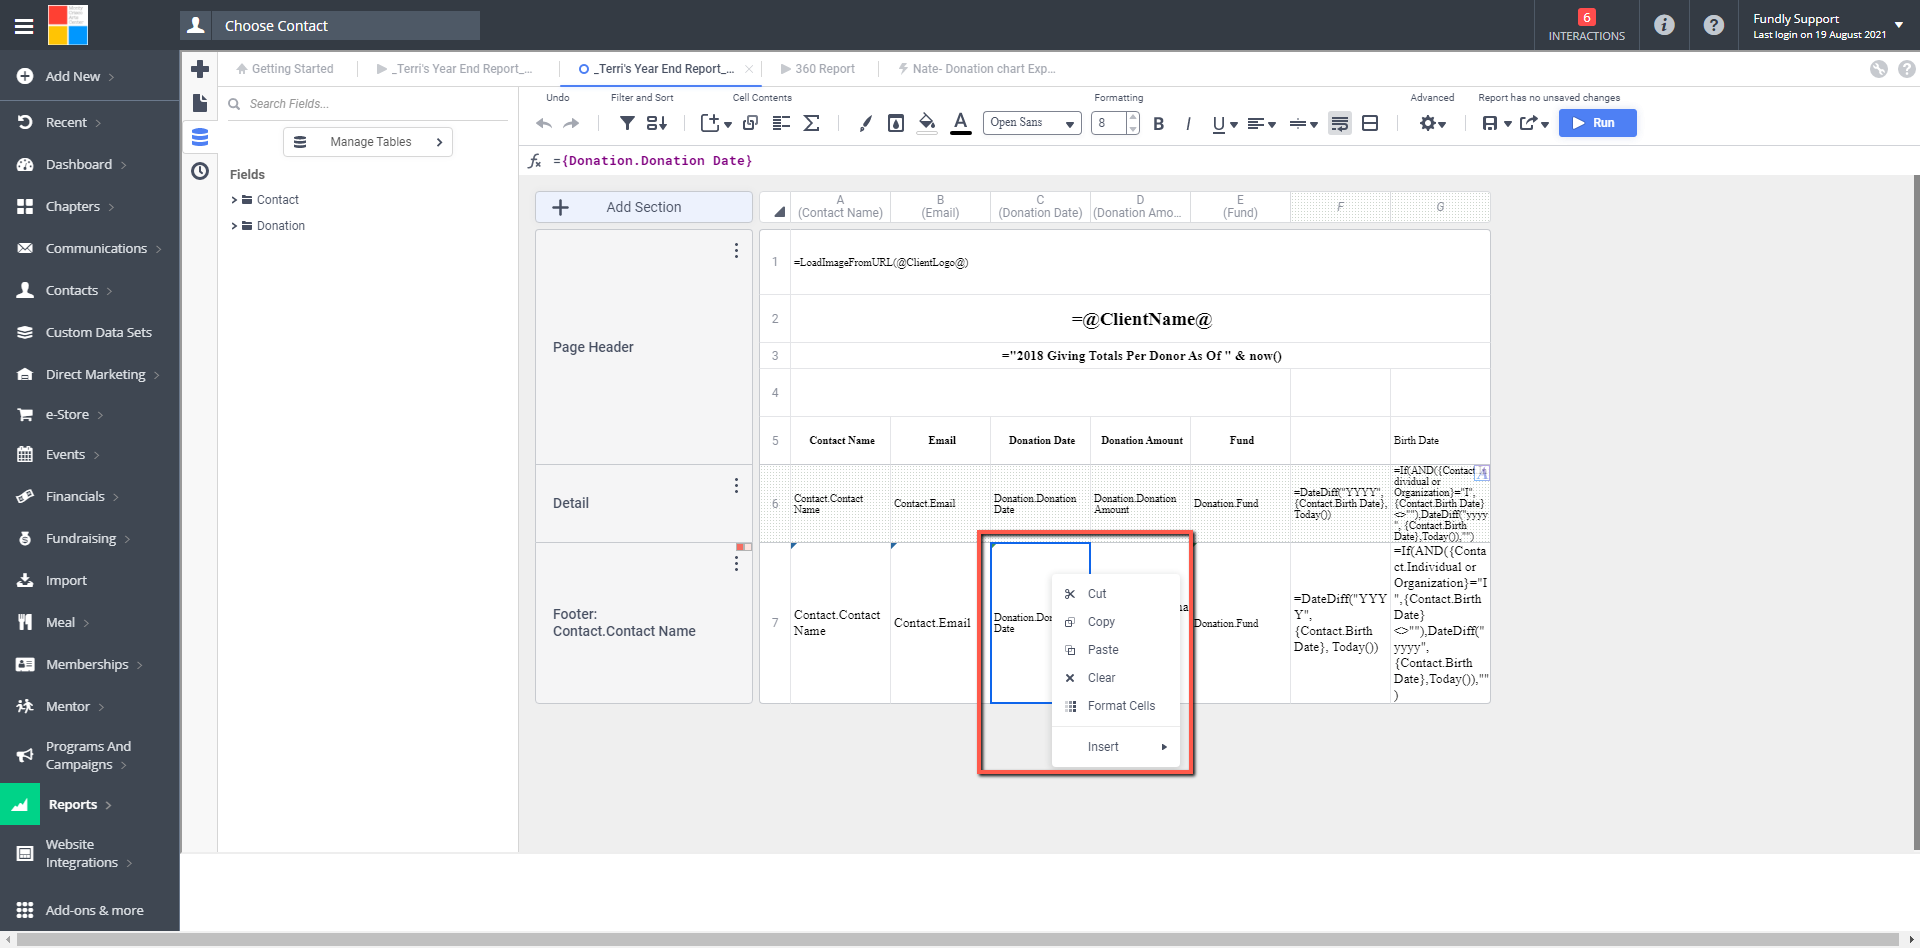
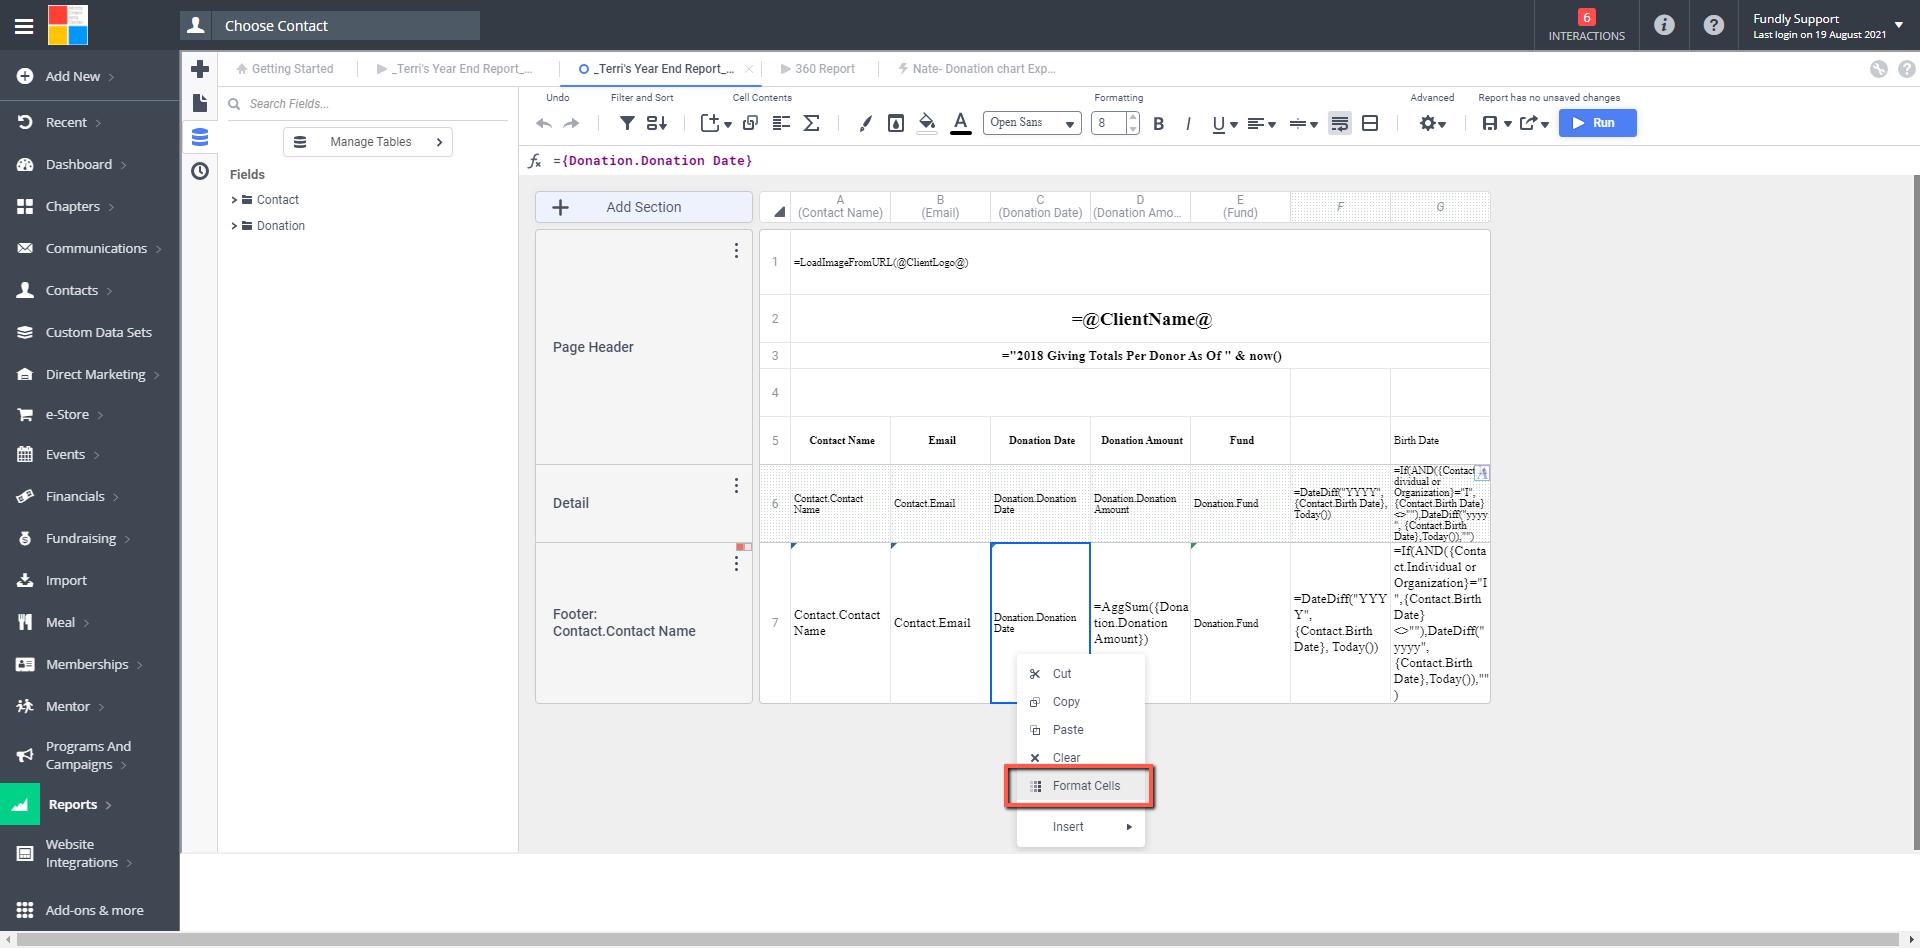
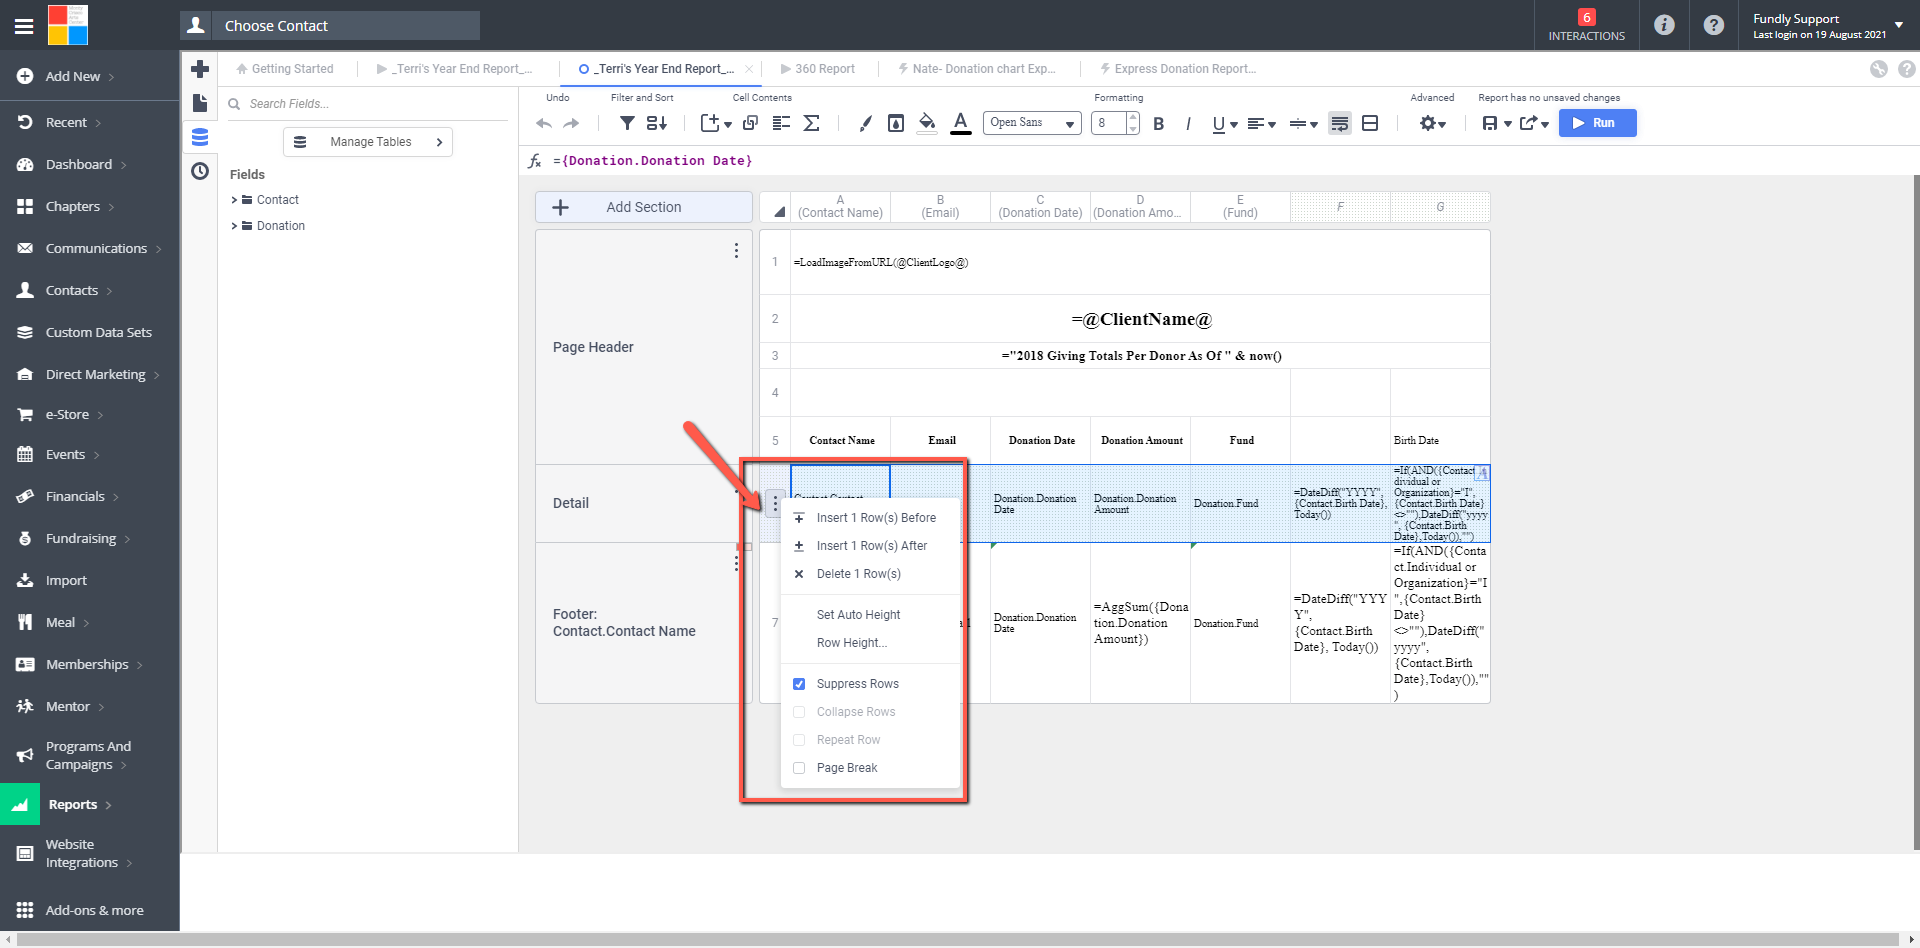
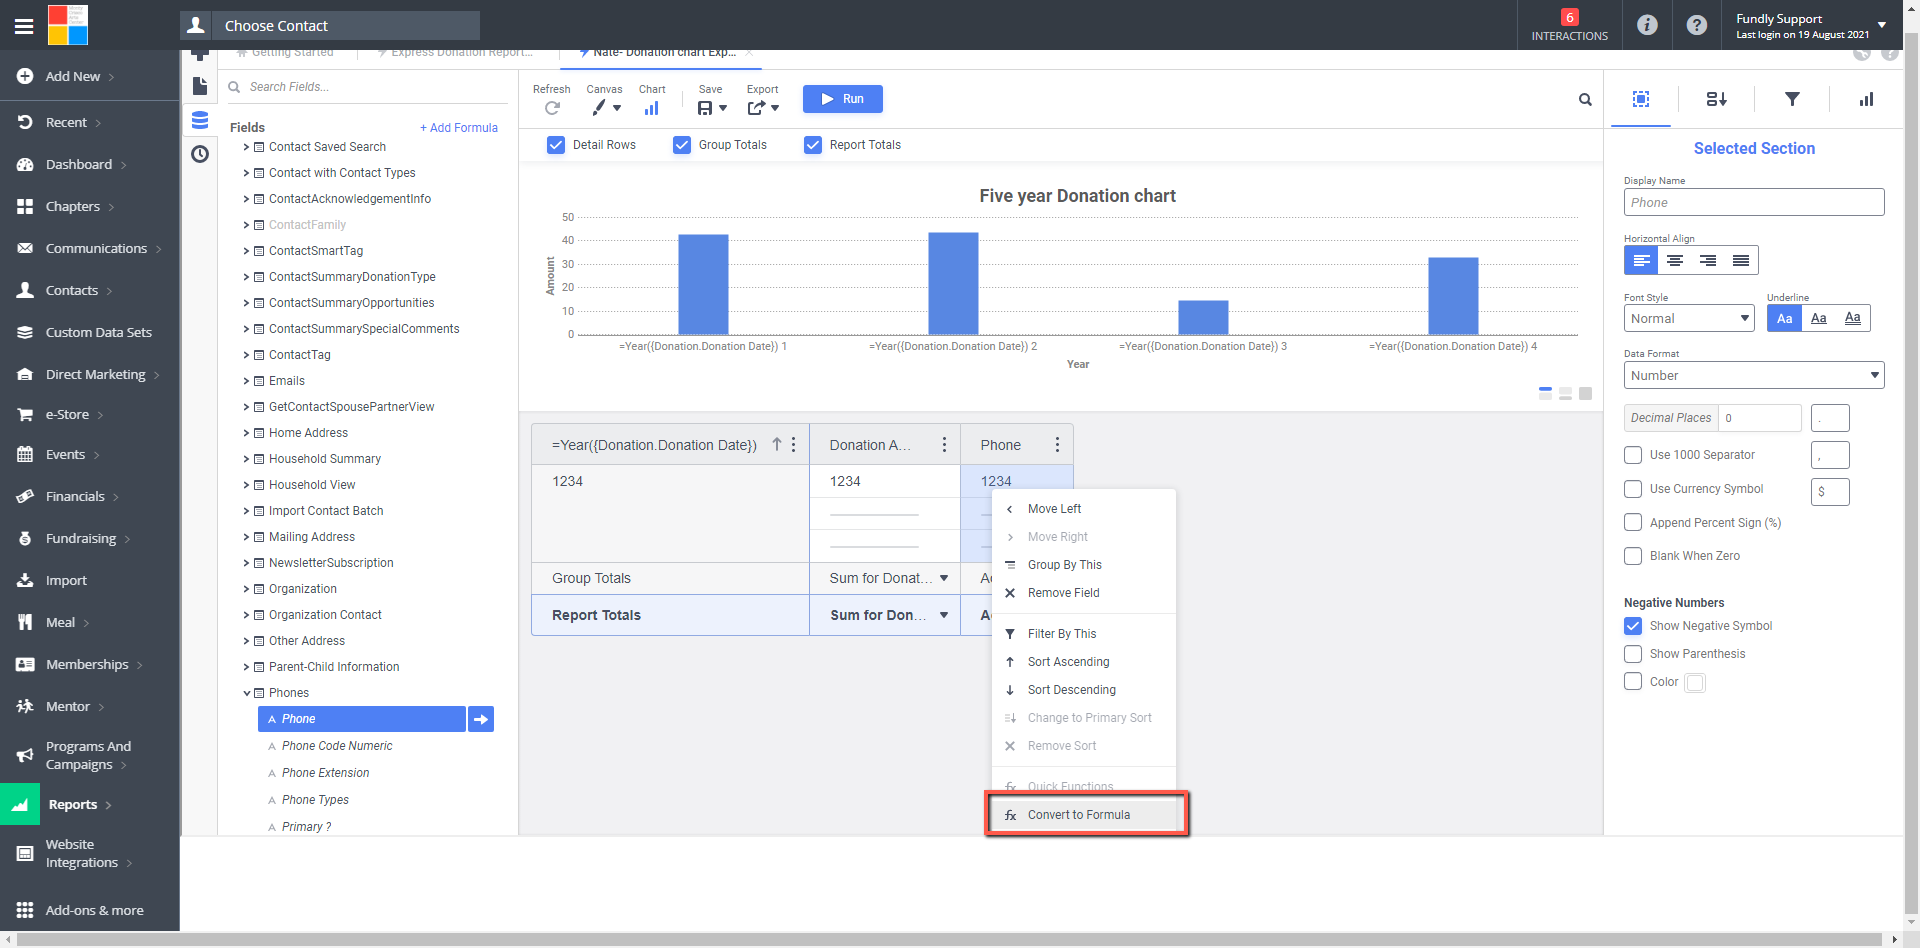
- In the Advanced Reports interface, you can do all of these things (and more). The Advanced Reports and Cross-Tab Reports interfaces work much like Excel; you can right click on a column header, row header, or in a cell to obtain a contextual menu that will allow you to add/remove columns/rows, apply conditional formatting and more (see 1st screen shot below). You can split and merge cells using the icons on the toolbar (2nd screen shot below).
- In the Express View interface, you can add columns by clicking the Add Formula link in the upper left of the field list (top screen show below); however, you cannot merge cells or add rows.
- In all of the custom reports interfaces, you can resize columns and rows by hovering between two cells in the column header or row header to produce a double headed arrow and then drag to resize (similar to Excel).
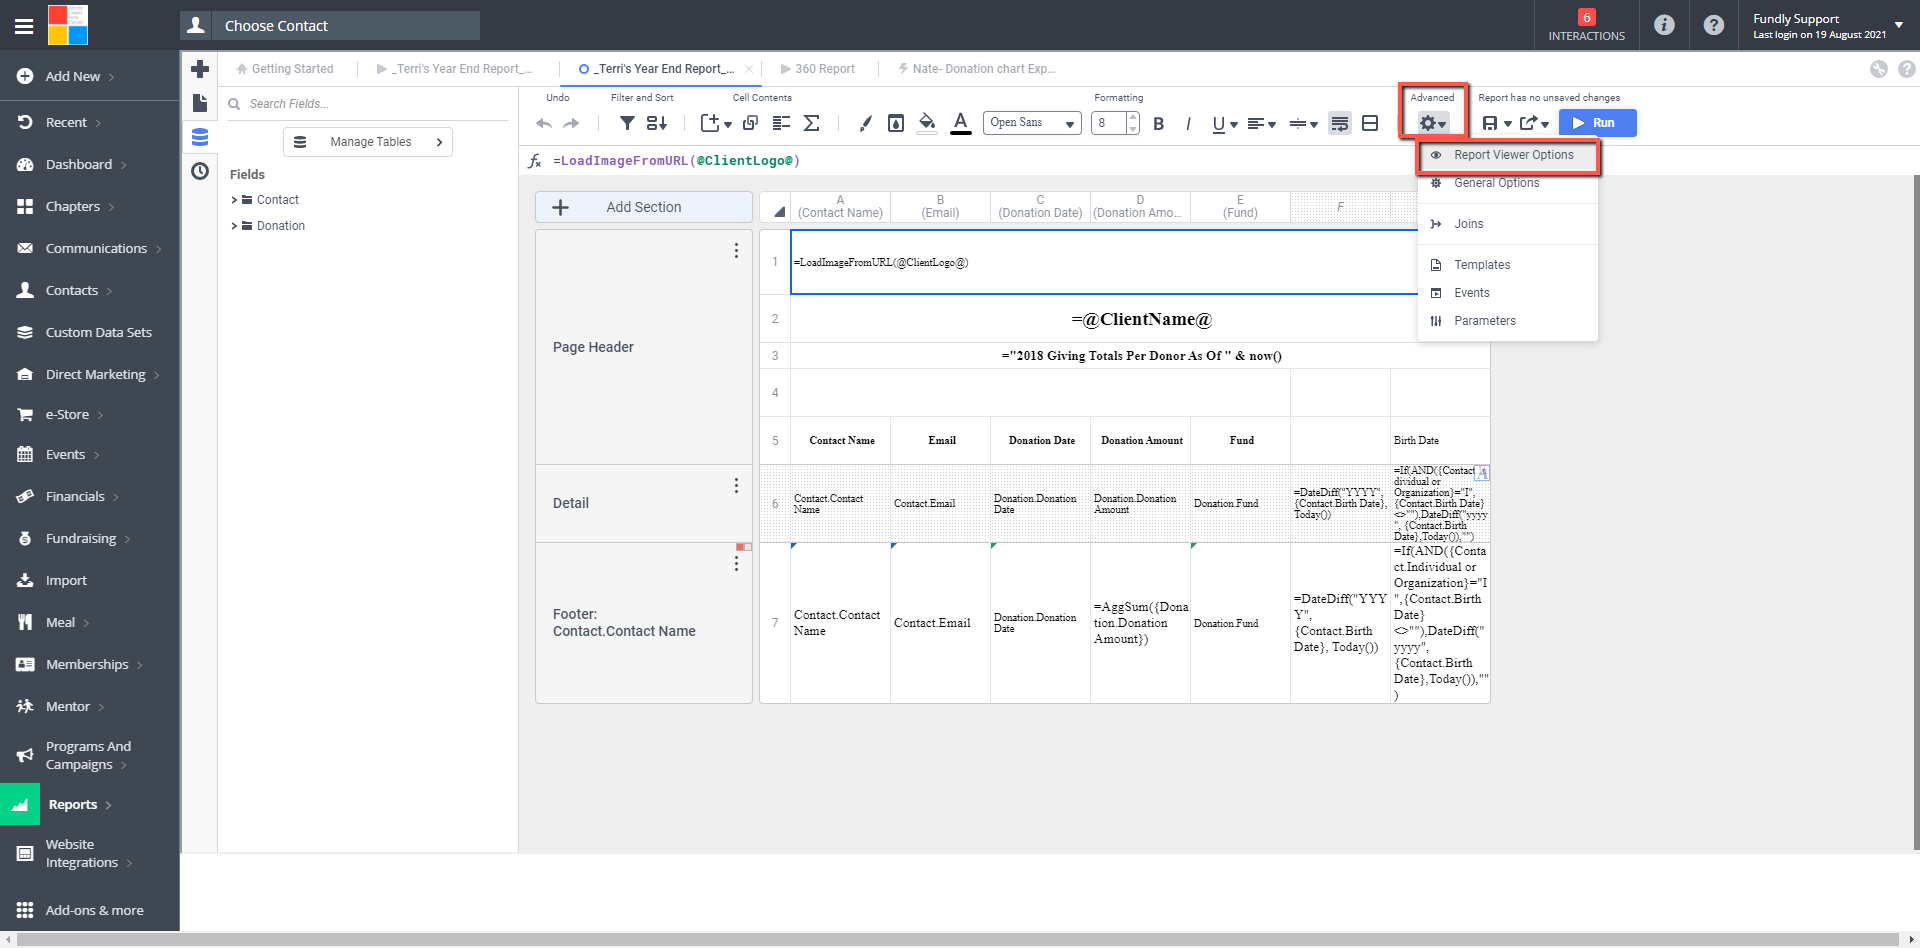
- If you find that resizing the columns/rows doesn't appear to make any difference to how the run/live report appears on the screen in an Advanced Report or Cross-Tab report, you may need to adjust the "simulate PDF setting." This setting keeps your onscreen report sized as if it were being printed on 8.5" x 11" paper. If you turn this setting off, then your onscreen report will expand beyond a 8.5" x 11" display area. In Advanced Reports and Cross-Tab reports, find this setting in Advanced toolbar (Gear wheel): Report Viewer.
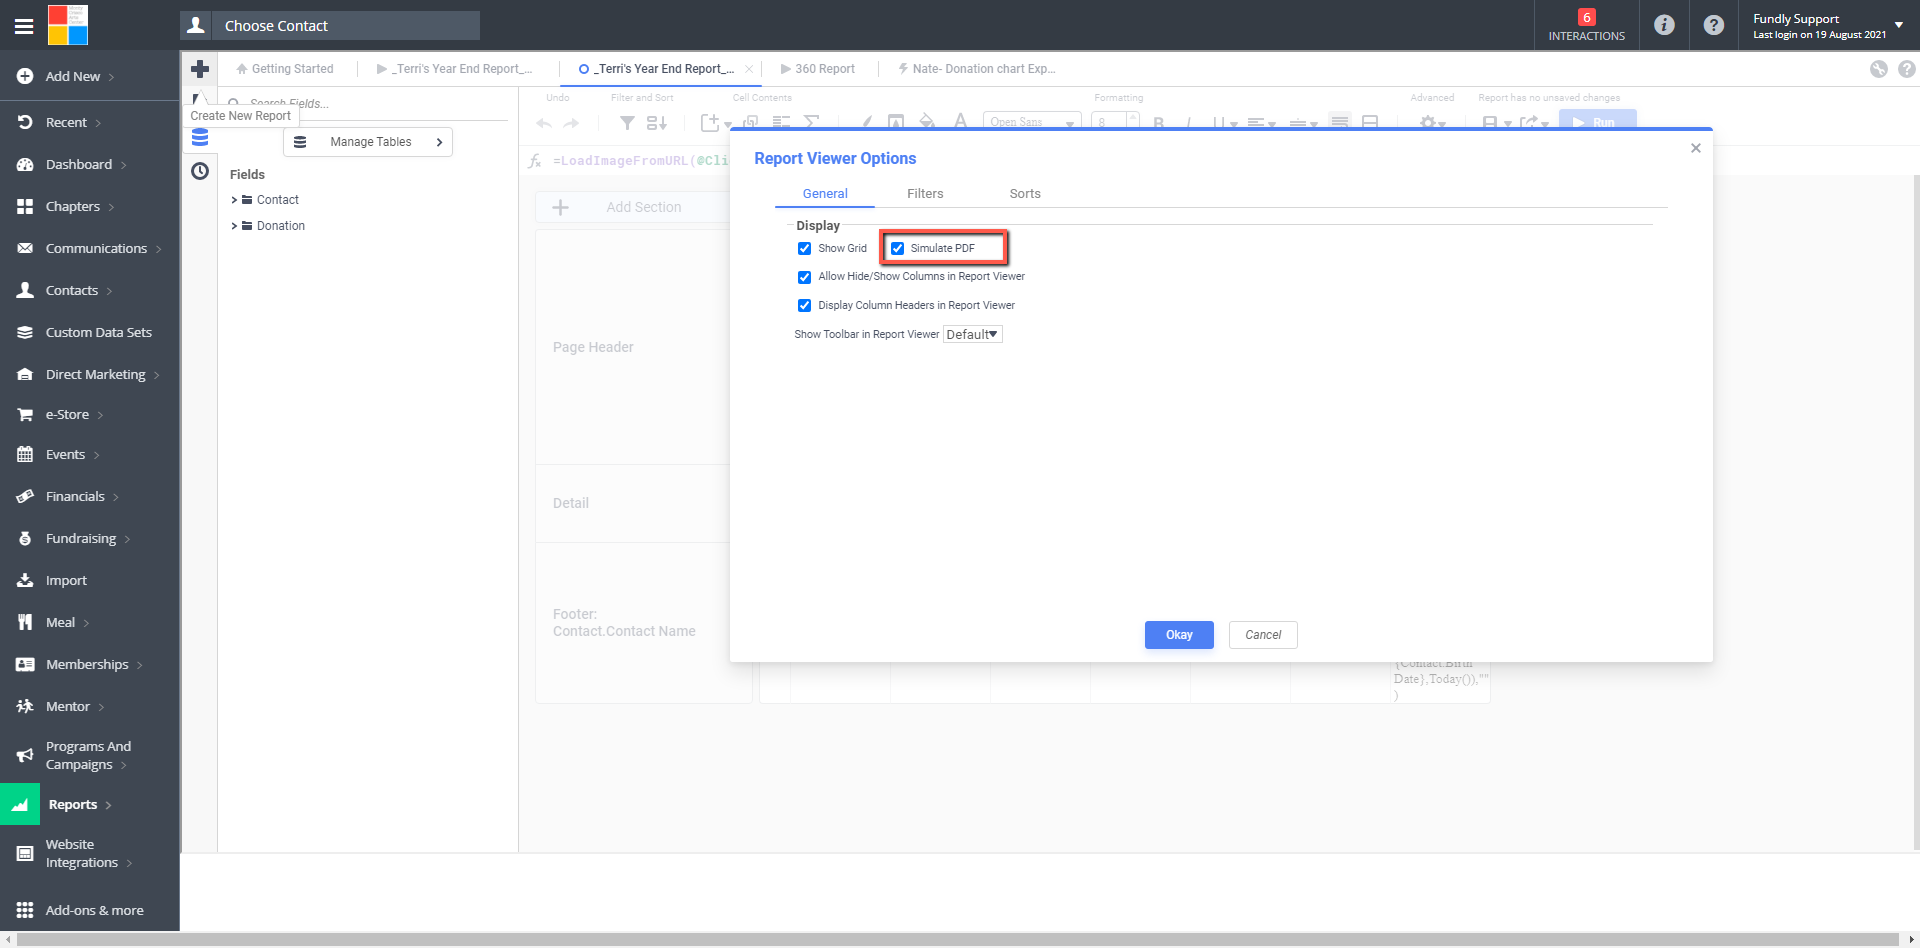
- If you find that resizing the columns/rows doesn't appear to make any difference to how the run/live report appears on the screen in an Advanced Report or Cross-Tab report, you may need to adjust the "simulate PDF setting." This setting keeps your onscreen report sized as if it were being printed on 8.5" x 11" paper. If you turn this setting off, then your onscreen report will expand beyond a 8.5" x 11" display area. In Advanced Reports and Cross-Tab reports, find this setting in Advanced toolbar (Gear wheel): Report Viewer.
- All of the various report interfaces provide options for adjusting the formatting on a report such as Bold, Italics, Font Color, Background Shading, Borders, etc. How these are added/controlled will vary by report interface. See the report interface specific tutorials in Part IV of the support library for more information.
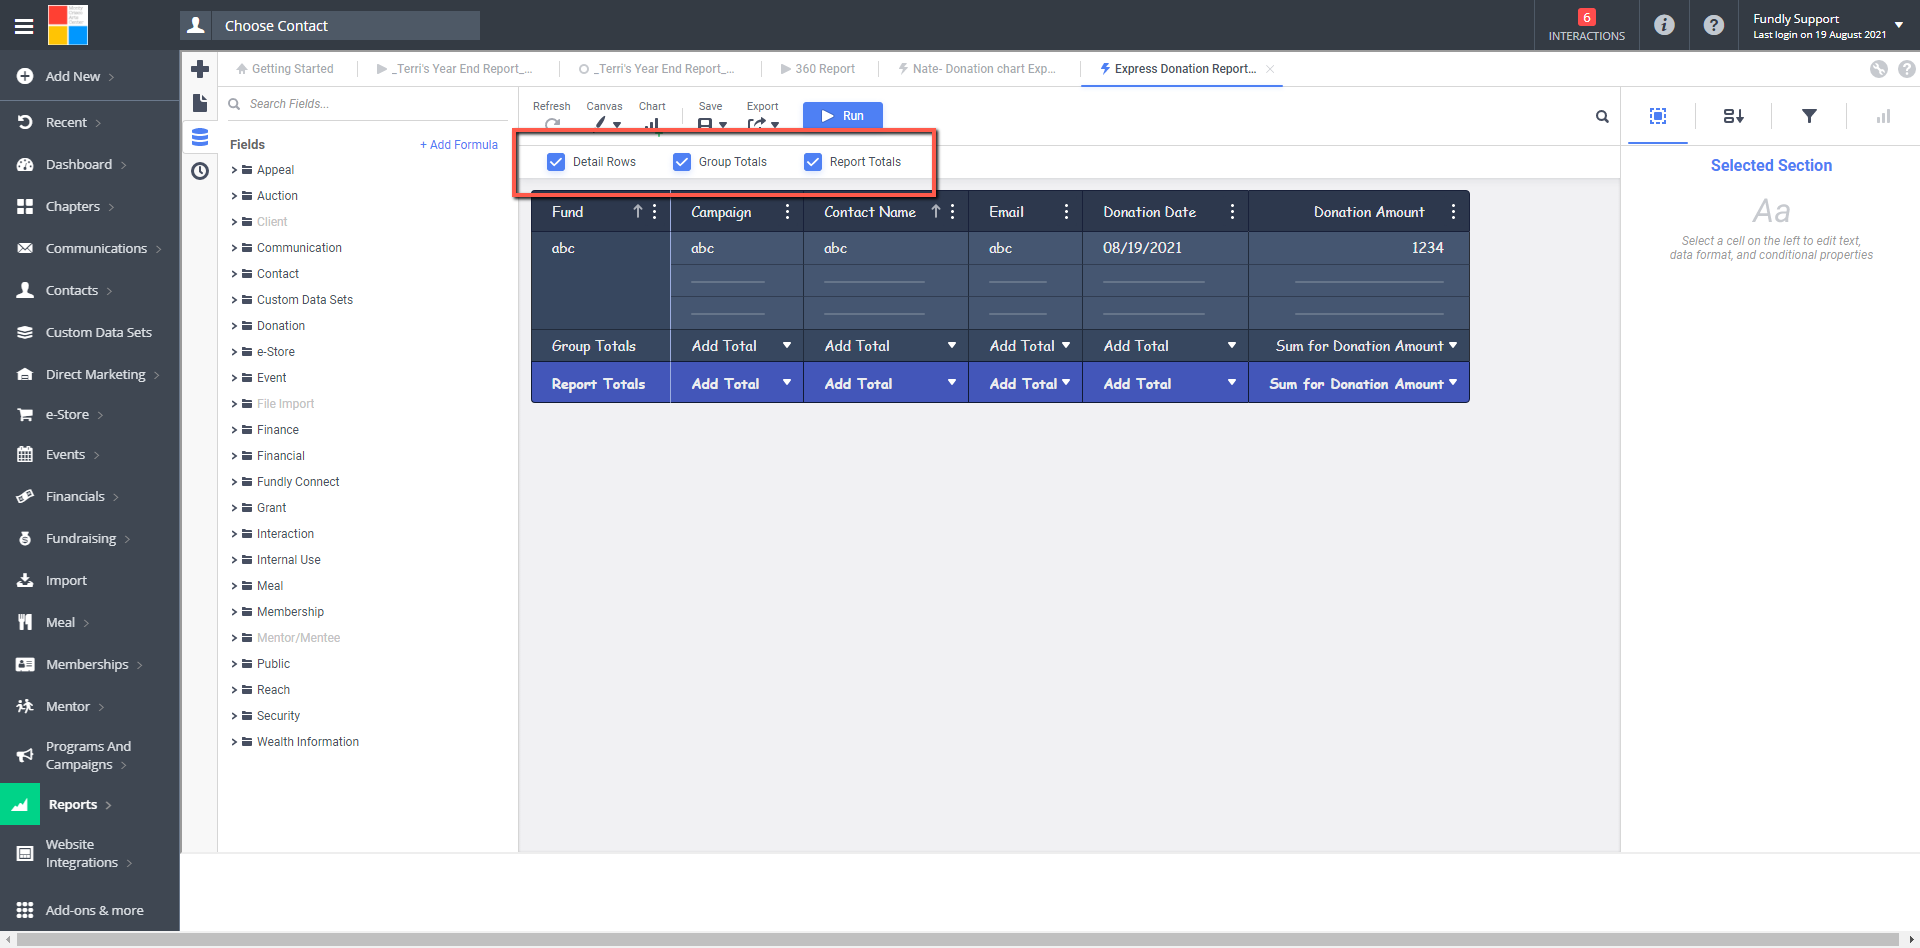
- In general, in the Express View interface, the formatting options are found on the Selected Cells menu/tab (square icon) on the right hand side of the screen.
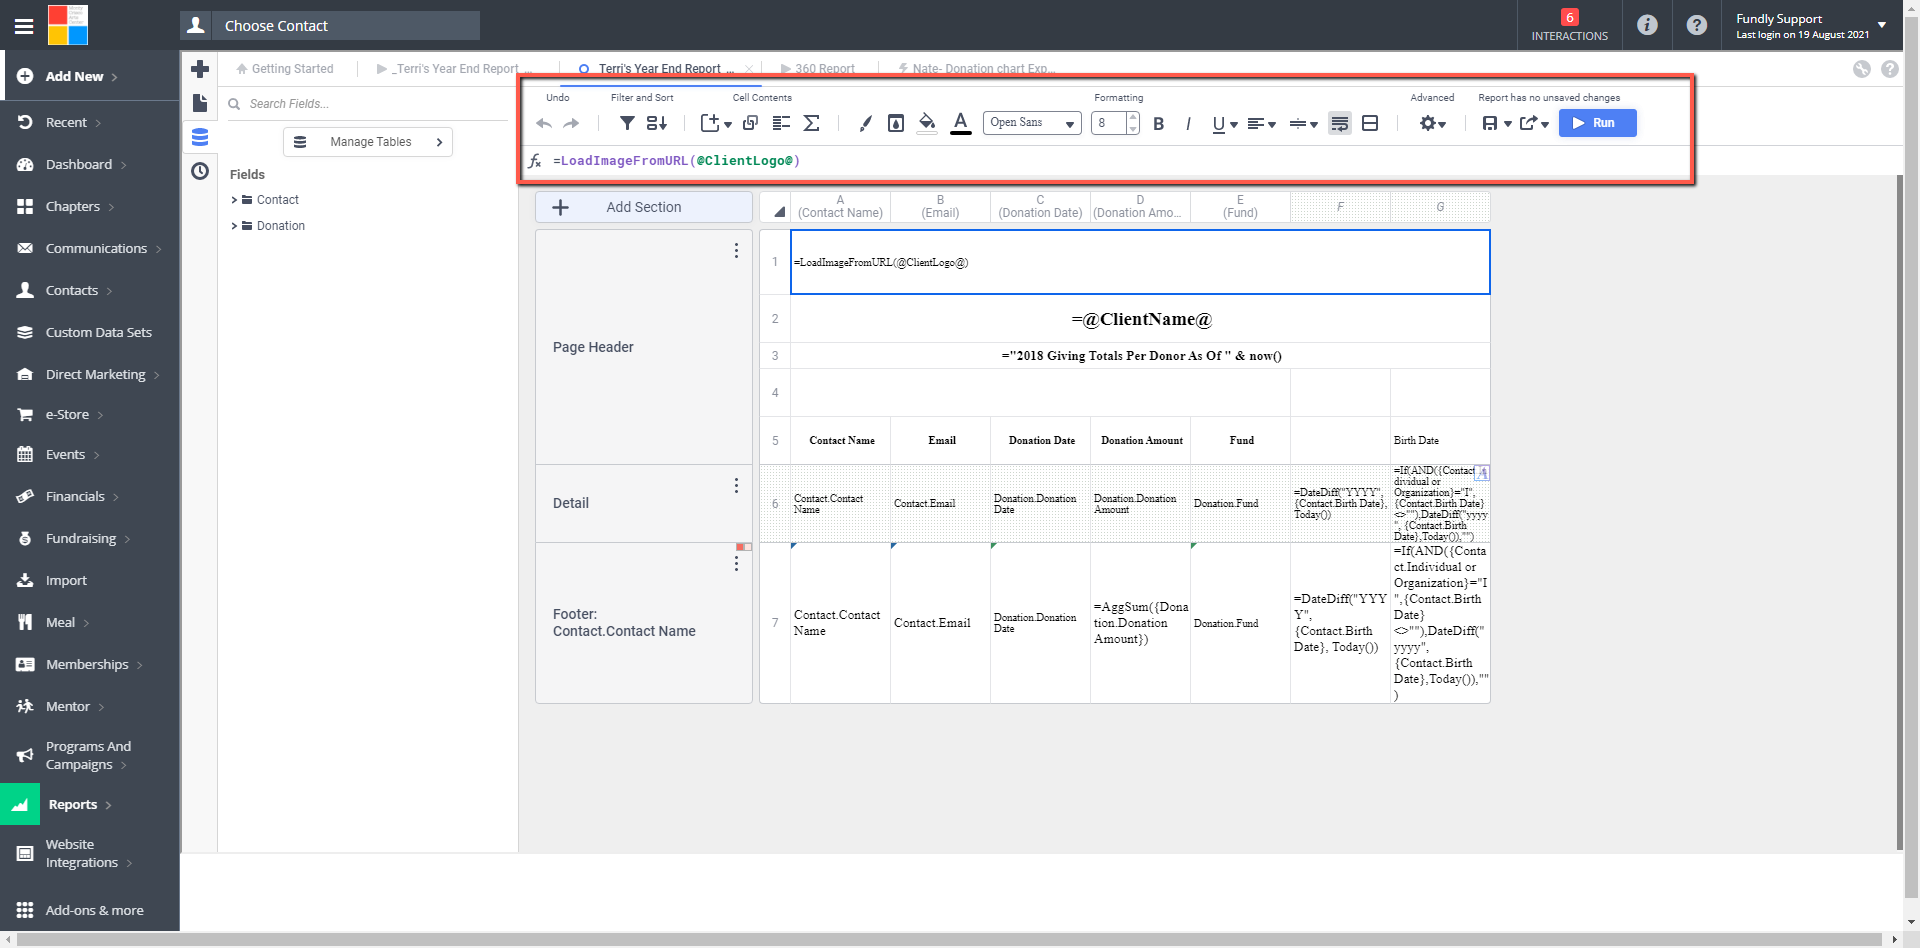
- In the Advanced Reports and Cross-Tab Reports interfaces, the formatting tools are found on the toolbar at the top of the screen (1st screenshot below) as well as by right clicking on a cell to bring up the contextual menu (2nd screen shot below).
- In general, in the Express View interface, the formatting options are found on the Selected Cells menu/tab (square icon) on the right hand side of the screen.
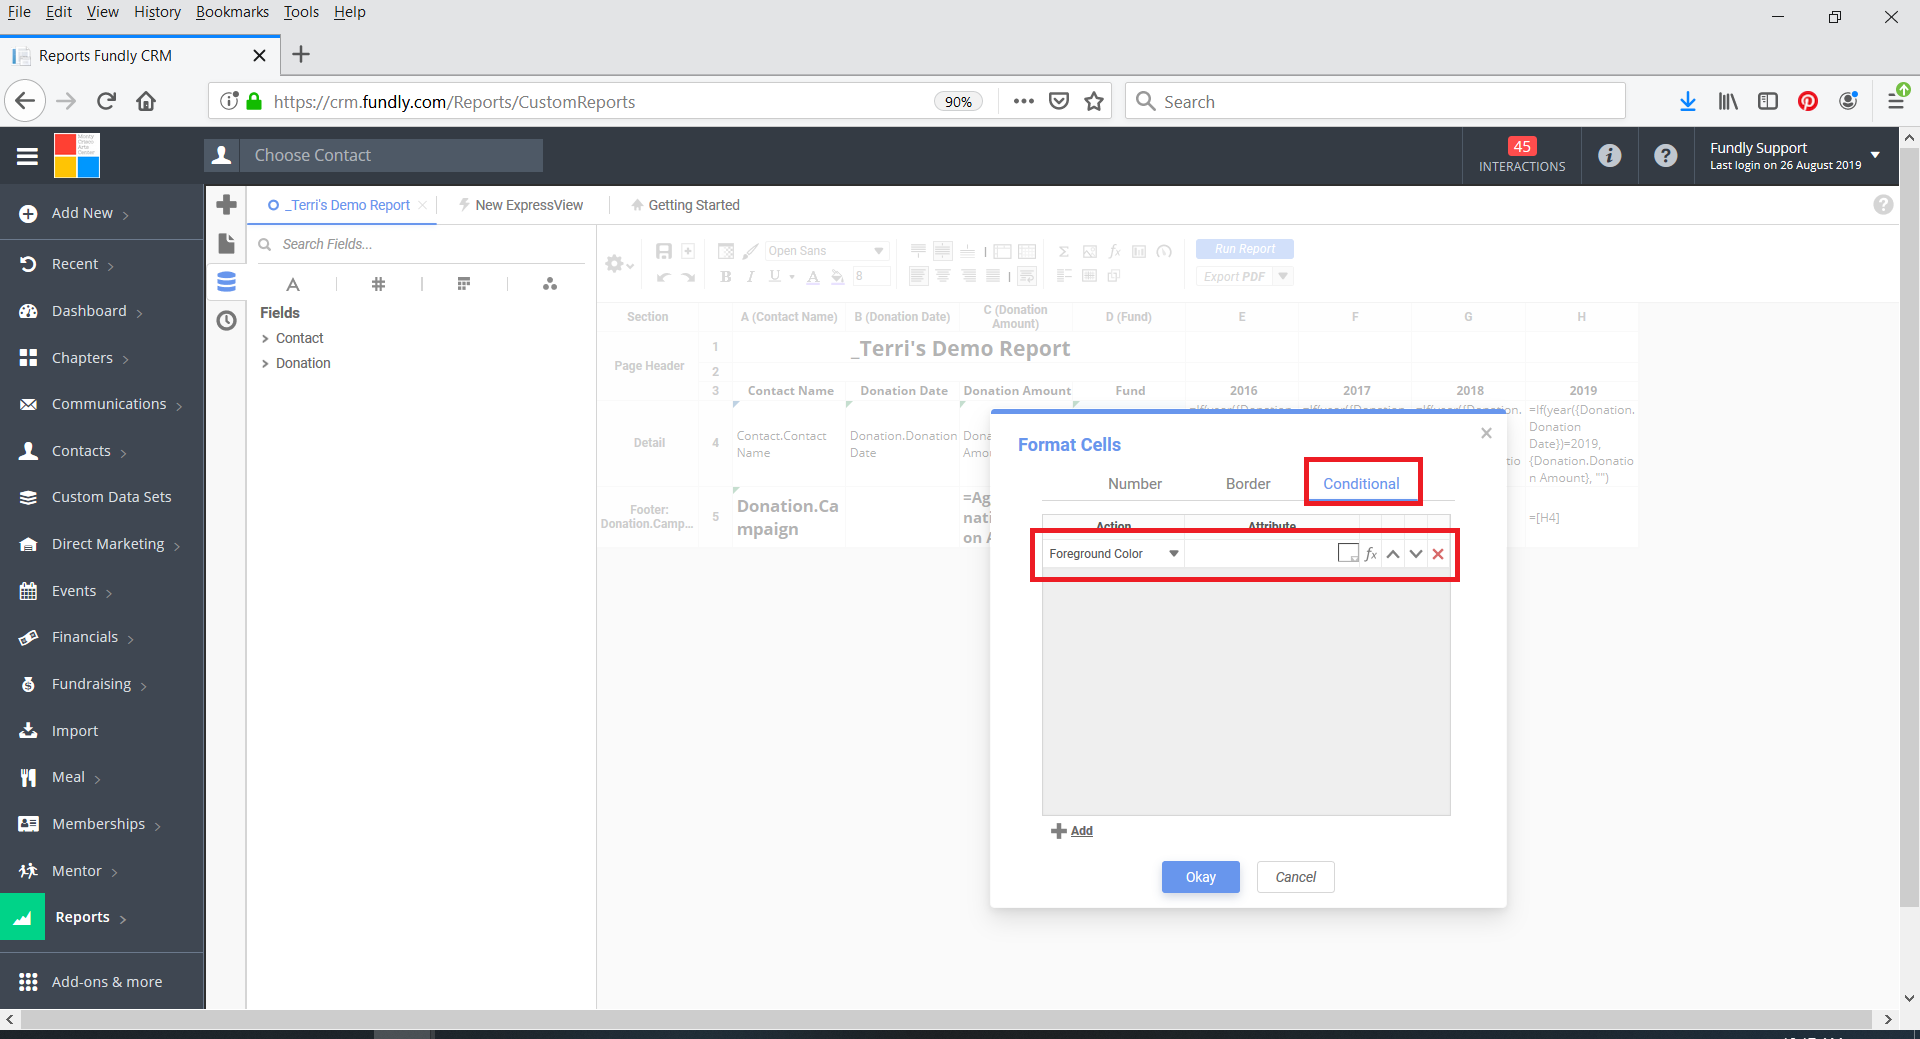
- In the Advanced Reports and Cross-Tab reports interface, you can add conditional formatting to your report, which allows you to apply automatic formatting to your report based on conditions or rules (for example, if you want to apply green font to every donation over $25 on your report automatically). Right click in any cell and select Format and then the Conditional tab.
- You can adjust the formatting of a report by hiding columns and/or rows as well. It might be that you included a row/column on a report for purposes of validating/checking the report, but you don't want to see it on the final report.
- In Express Reports, you can hide rows (but not columns), if you add grouping to the report, after which, you can then use the Report Sections Display Options button on the toolbar to hide rows.
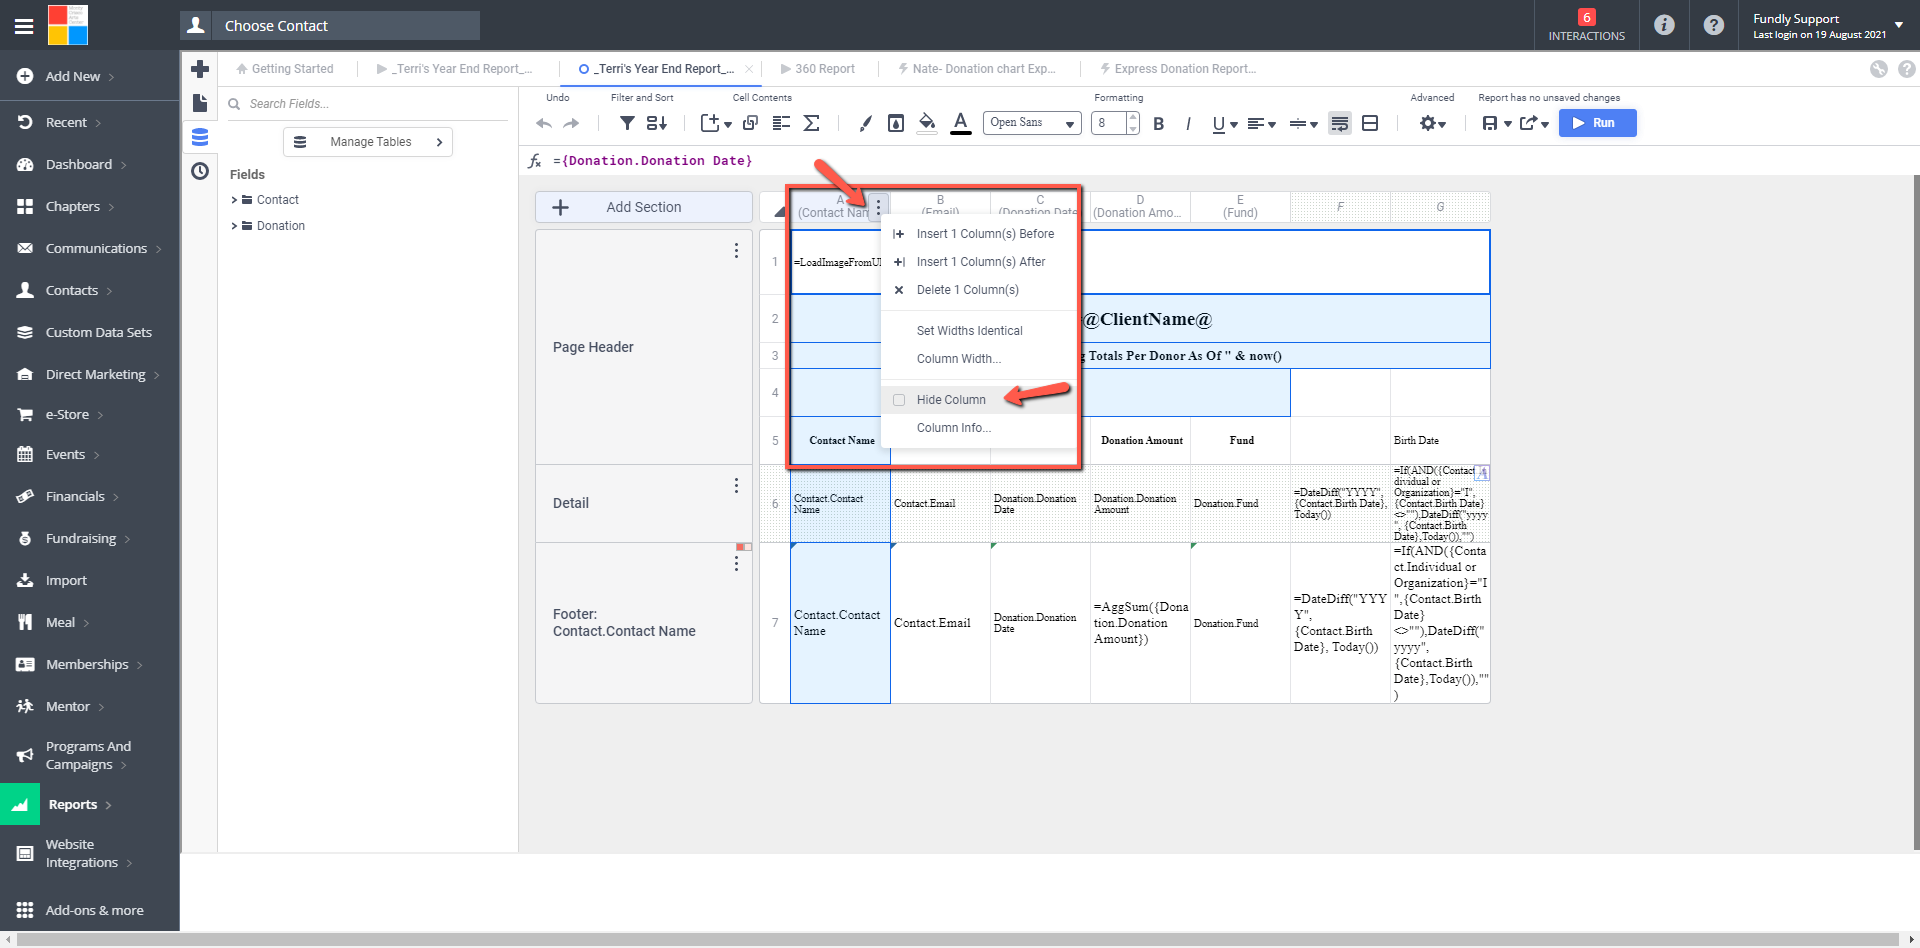
- In the Advanced Reports and Cross-Tab Reports interfaces, you can hide columns and rows by right clicking on a column or row header and selecting Hide (column)/Suppress (rows)
- Additionally, in the Advanced Reports and Cross-Tab Reports interfaces, you can apply conditional formatting to hide some rows if they meet certain conditions by right clicking on a cell or row header or column header and selecting format and then clicking on the conditional tab.
- In Express Reports, you can hide rows (but not columns), if you add grouping to the report, after which, you can then use the Report Sections Display Options button on the toolbar to hide rows.
- You can control the sort order of your report/the data on your report by telling the report which field or fields to sort by. For example, you could sort a report that shows all donors who made a donation in 2018 by donor last name, by household ID (so all contacts in the same household are listed together), by donation date, or by donation amount. You can sort by more than one field so that, perhaps, you sort by last name and then by first name or you sort by contact name and then by donation date.
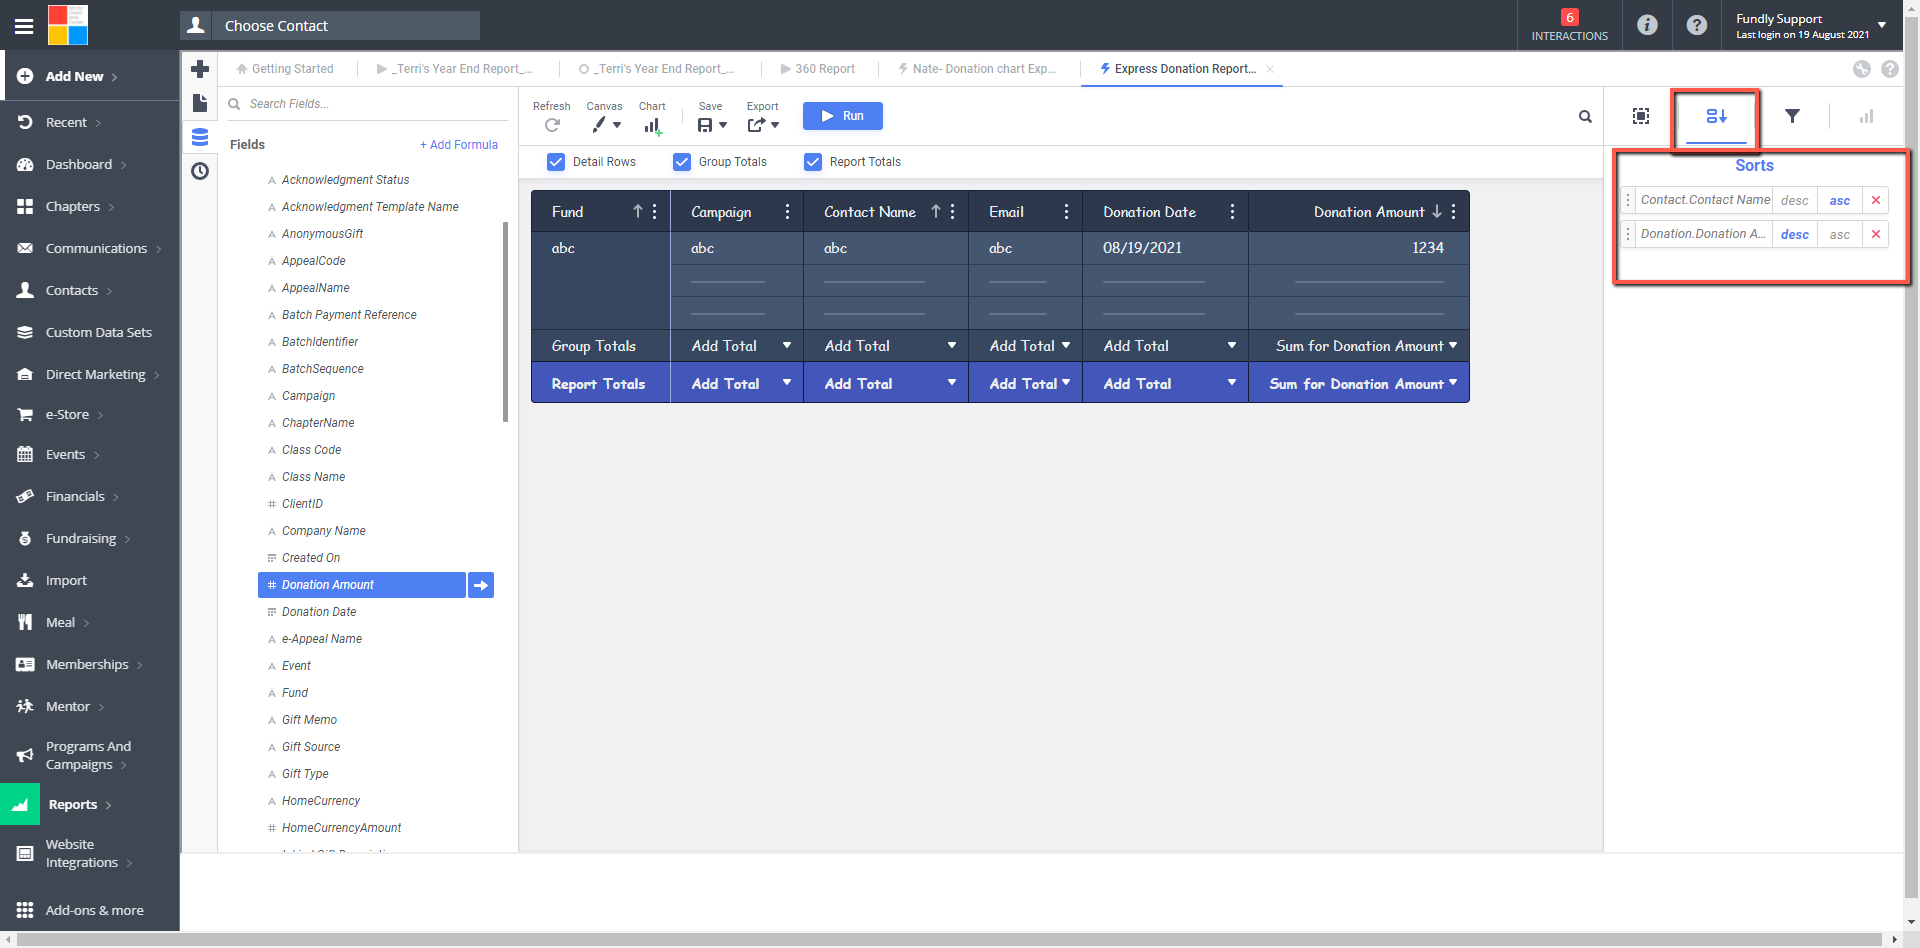
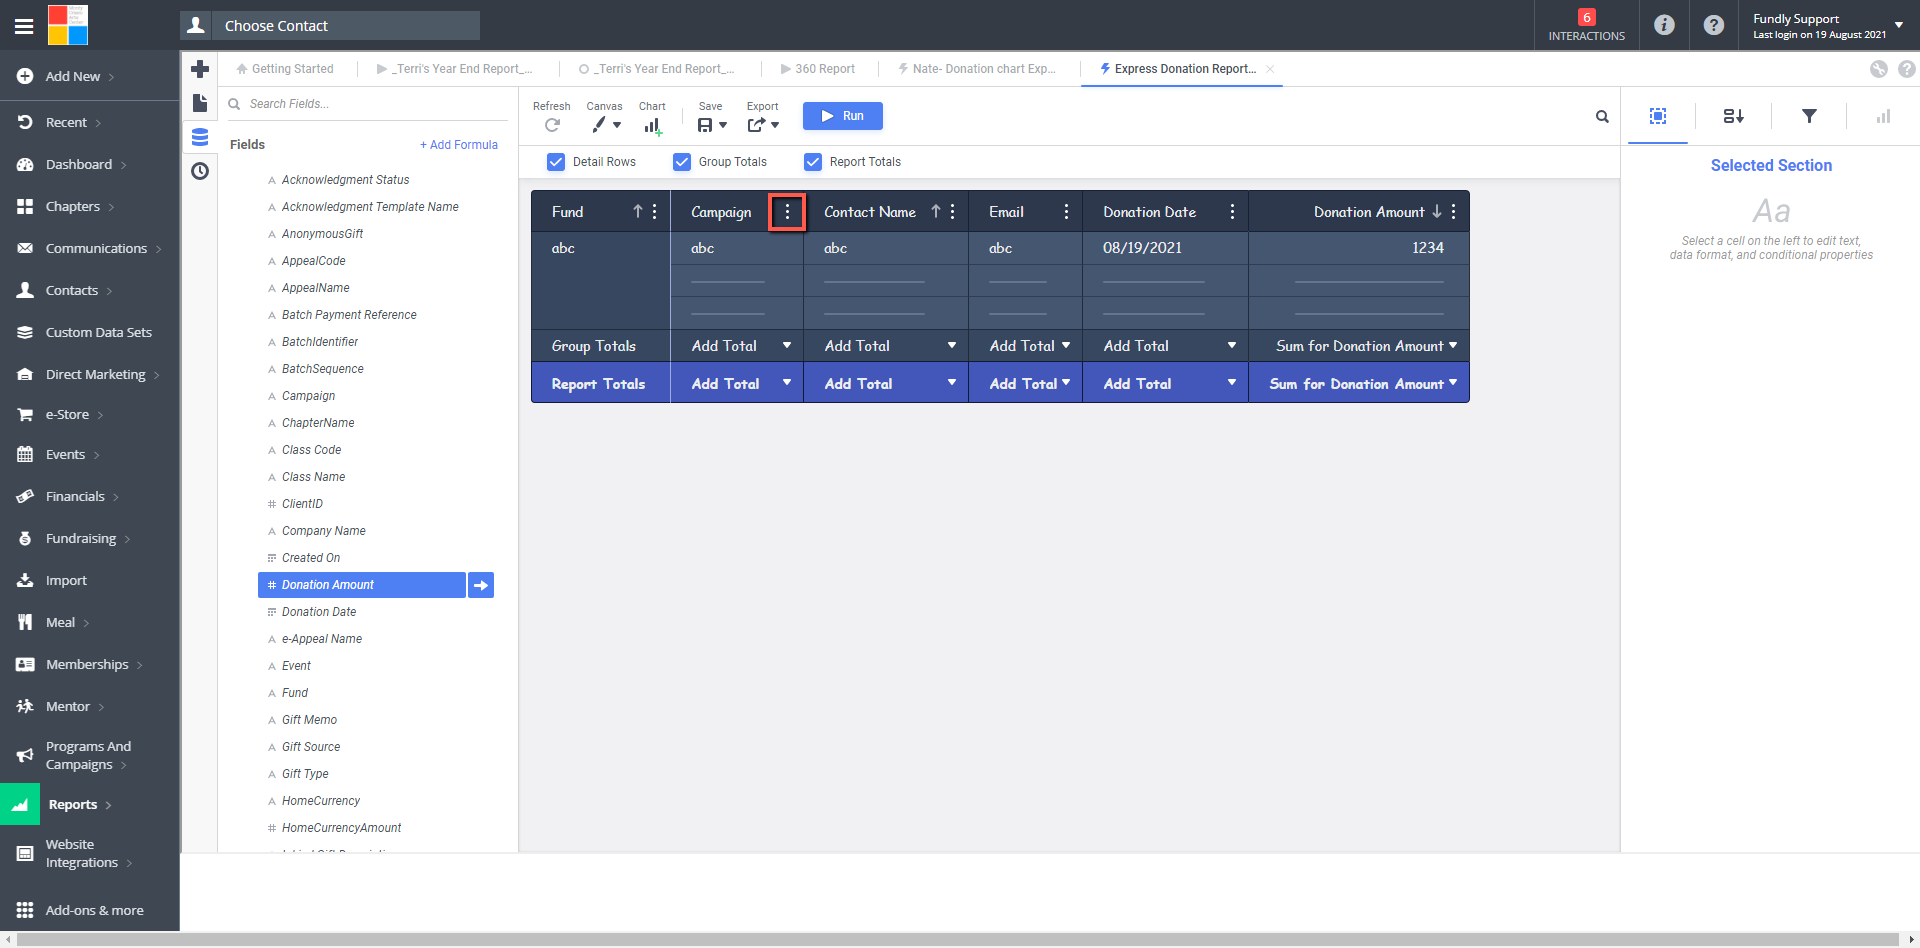
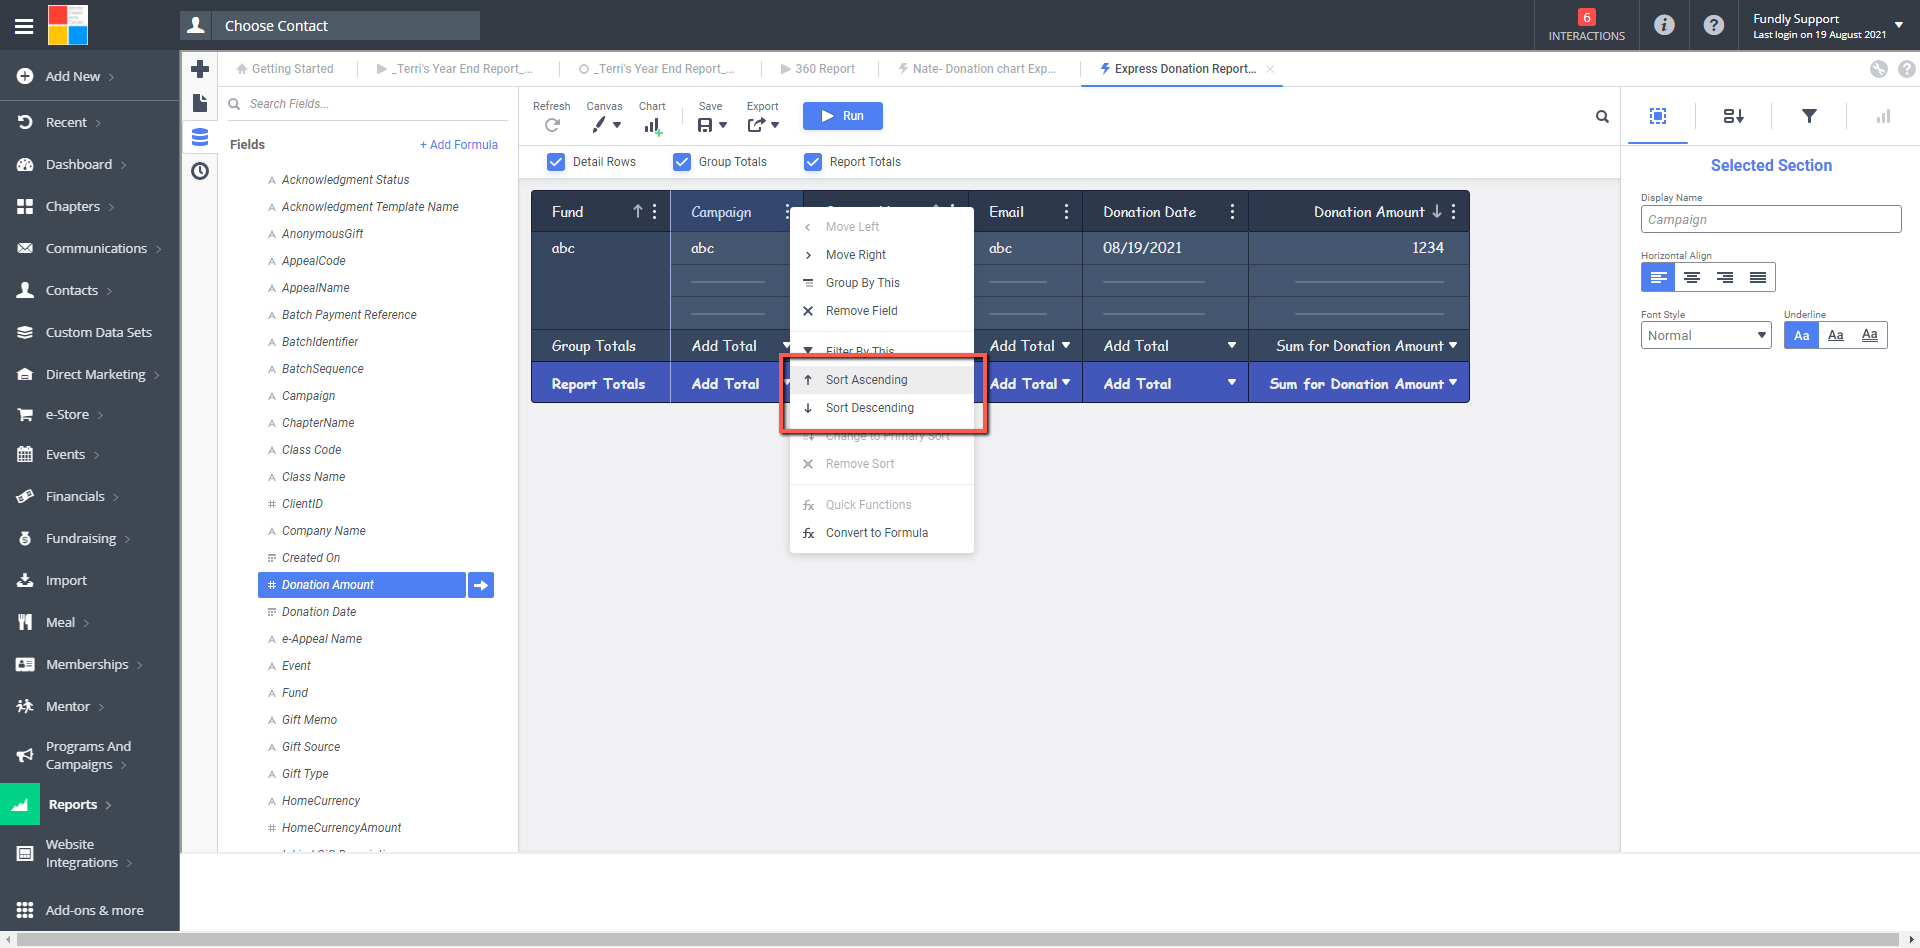
- In Express View, the sort order is set on the Sorts tab on the right (1st screen shot below) OR by clicking the three dots button in the upper right of any column and selecting the Sorts option (A-Z icon) on the radial menu (2nd and 3rd screen shot below).
OR
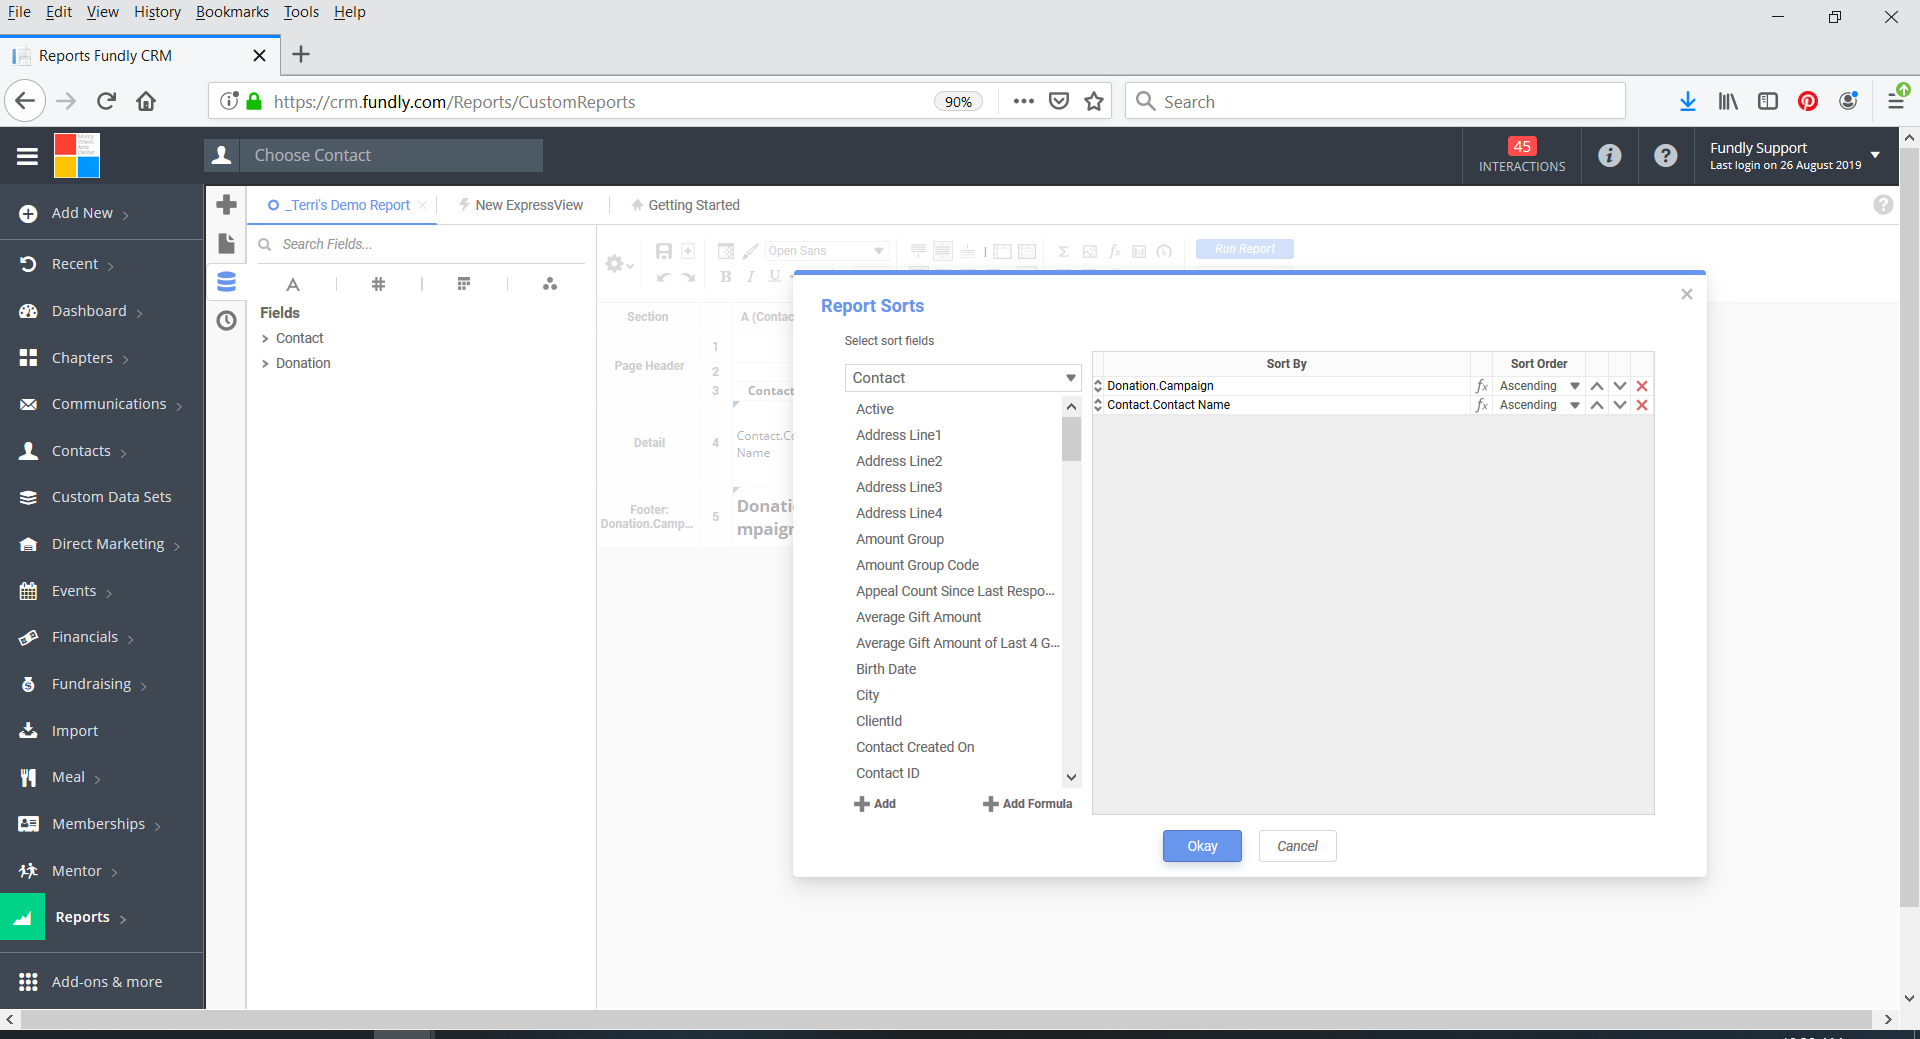
- In Advanced Reports and Cross-Tab reports, the sort order is set by clicking on Sort Options under Filters and Sorts and selecting Sorts.
- In Express View, the sort order is set on the Sorts tab on the right (1st screen shot below) OR by clicking the three dots button in the upper right of any column and selecting the Sorts option (A-Z icon) on the radial menu (2nd and 3rd screen shot below).
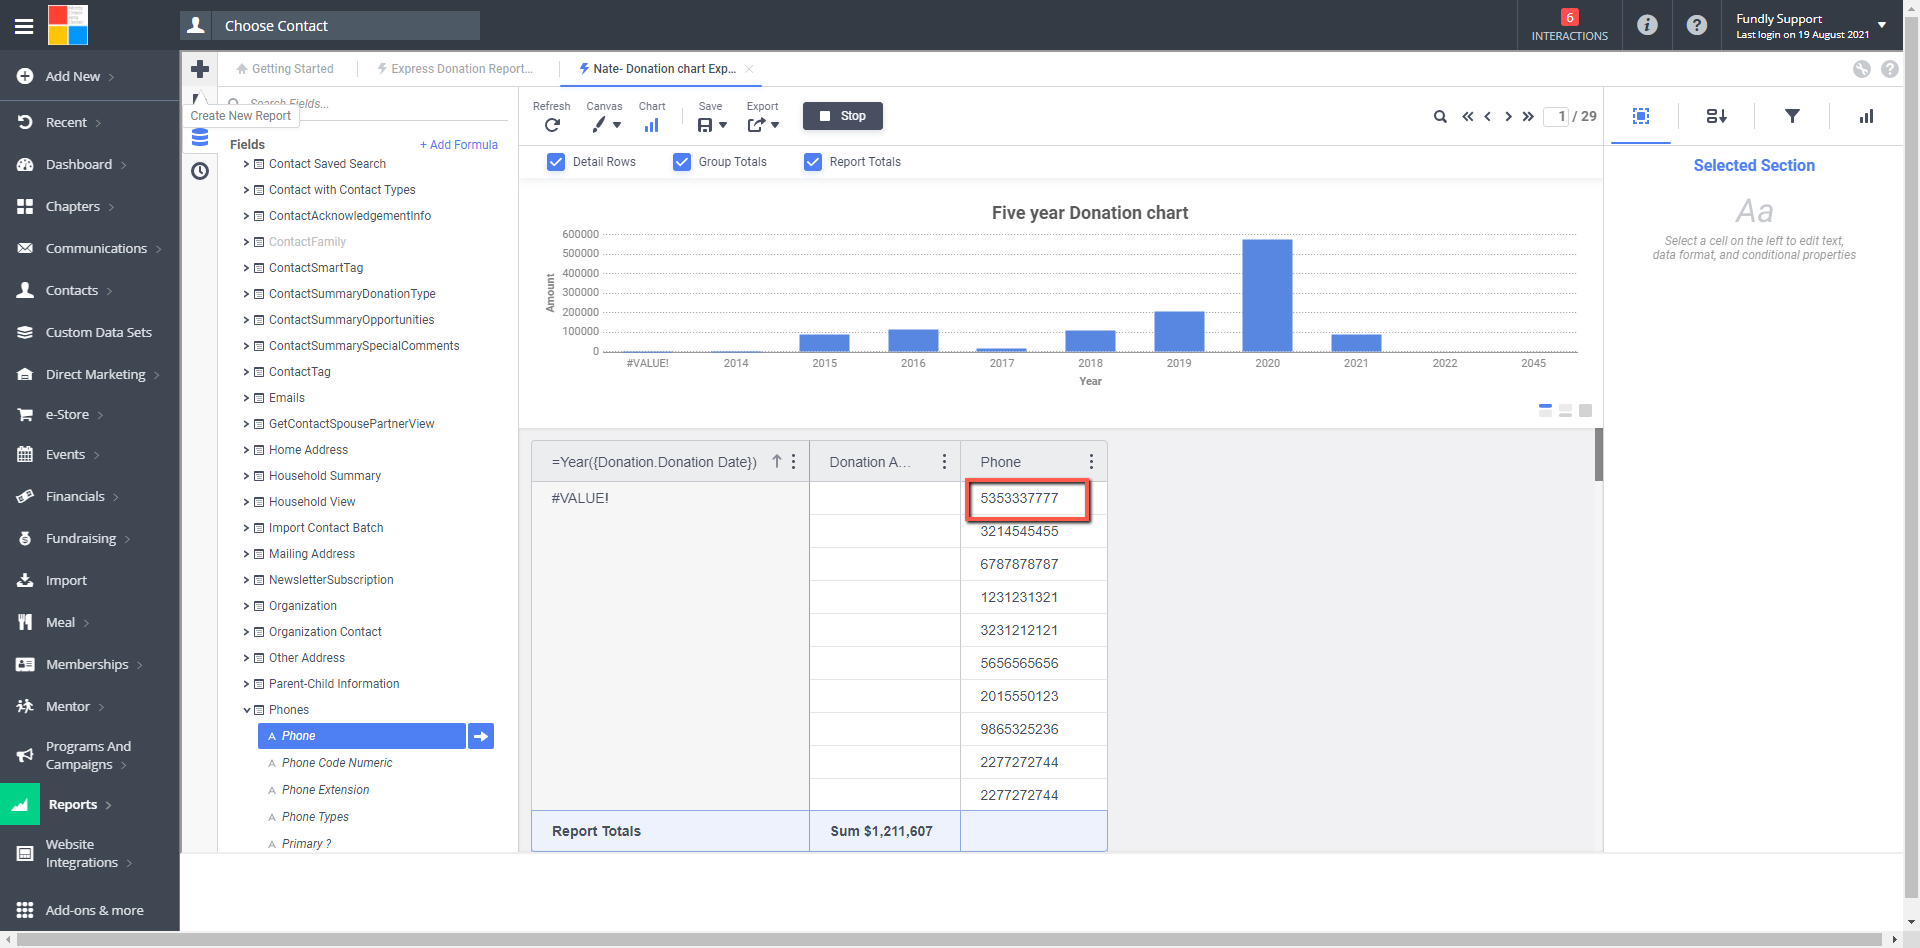
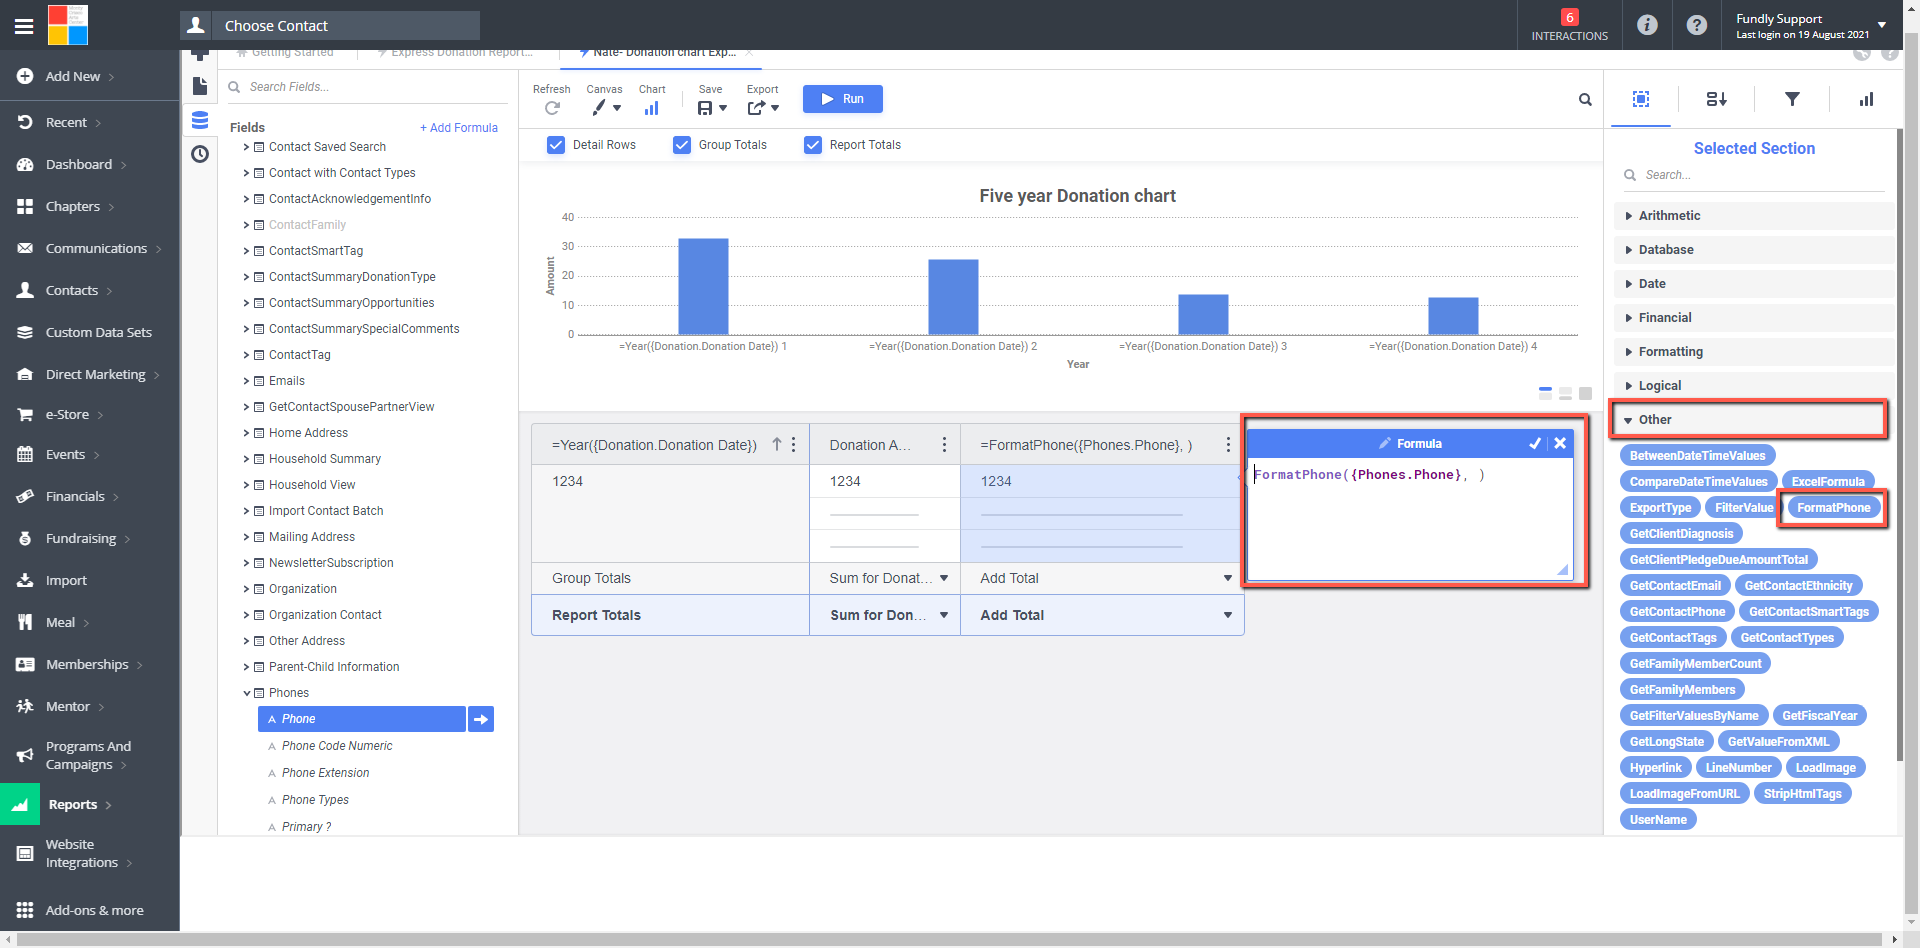
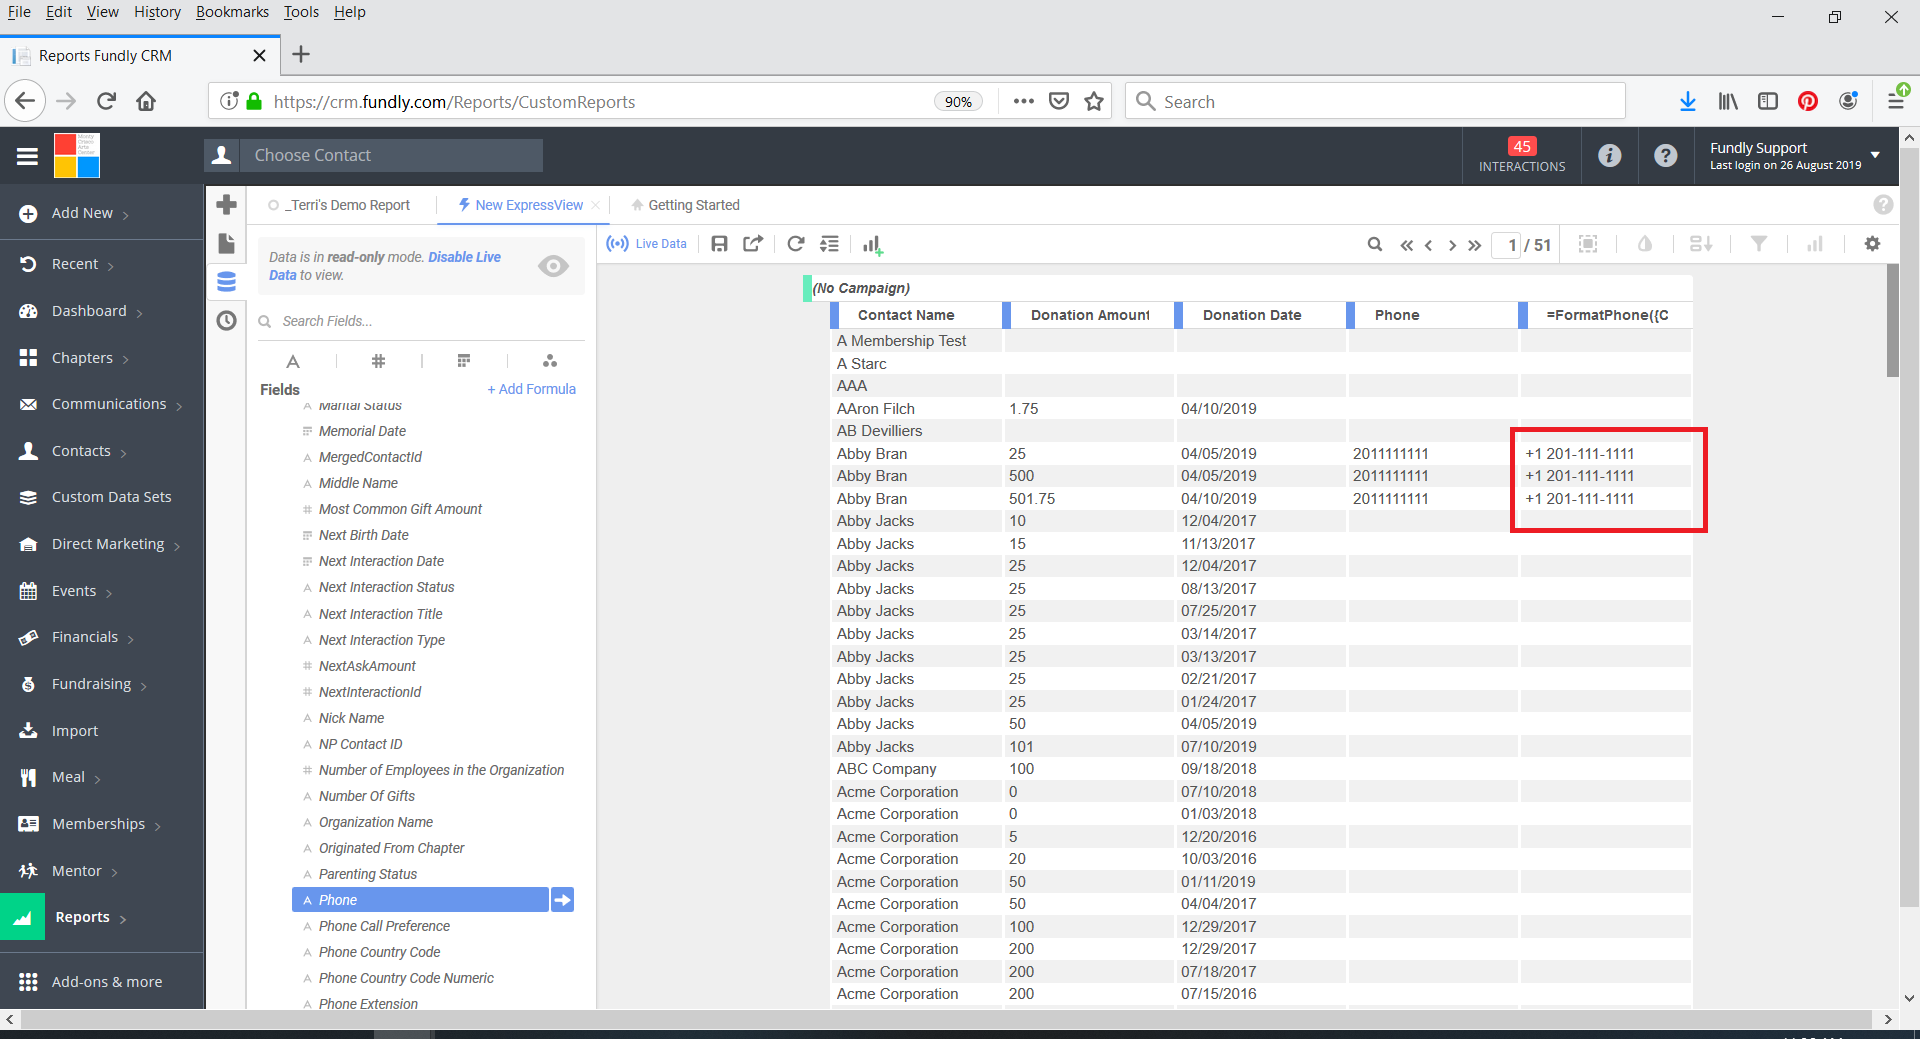
- There are a variety of formulas/functions that will allow you to control the formatting of particular types of data or particular fields in all of the custom reports formats (Express View, Advanced Reports, Cross-Tab Reports, and Dashboard Reports). For example, the "FormatPhone" function will format U.S. phone numbers "prettily" by adding parentheses around the area code, a space between the area code and the exchange, and a dash between the exchange and the last four digits. The first screen shot below (of an Express View report) is how the unformatted phone number would appear on the report; the 3rd screen shot shows the phone number's appearance after the function is applied to the field.
- Additional formatting functions/formulas include ones that change a date field to a "long date" that includes the day of the week and/or spelling out the month, rolling all contact types or tags per person into one row (instead of one tag/type per row), and converting currency from transaction currency to your system's home currency. We have separate tutorials in the support library that cover how to accomplish these various tasks. You may wish to spend some time exploring the "Formatting" and "Other" section of the function/formula area to become acquainted with the limitless possibilities for report formatting.
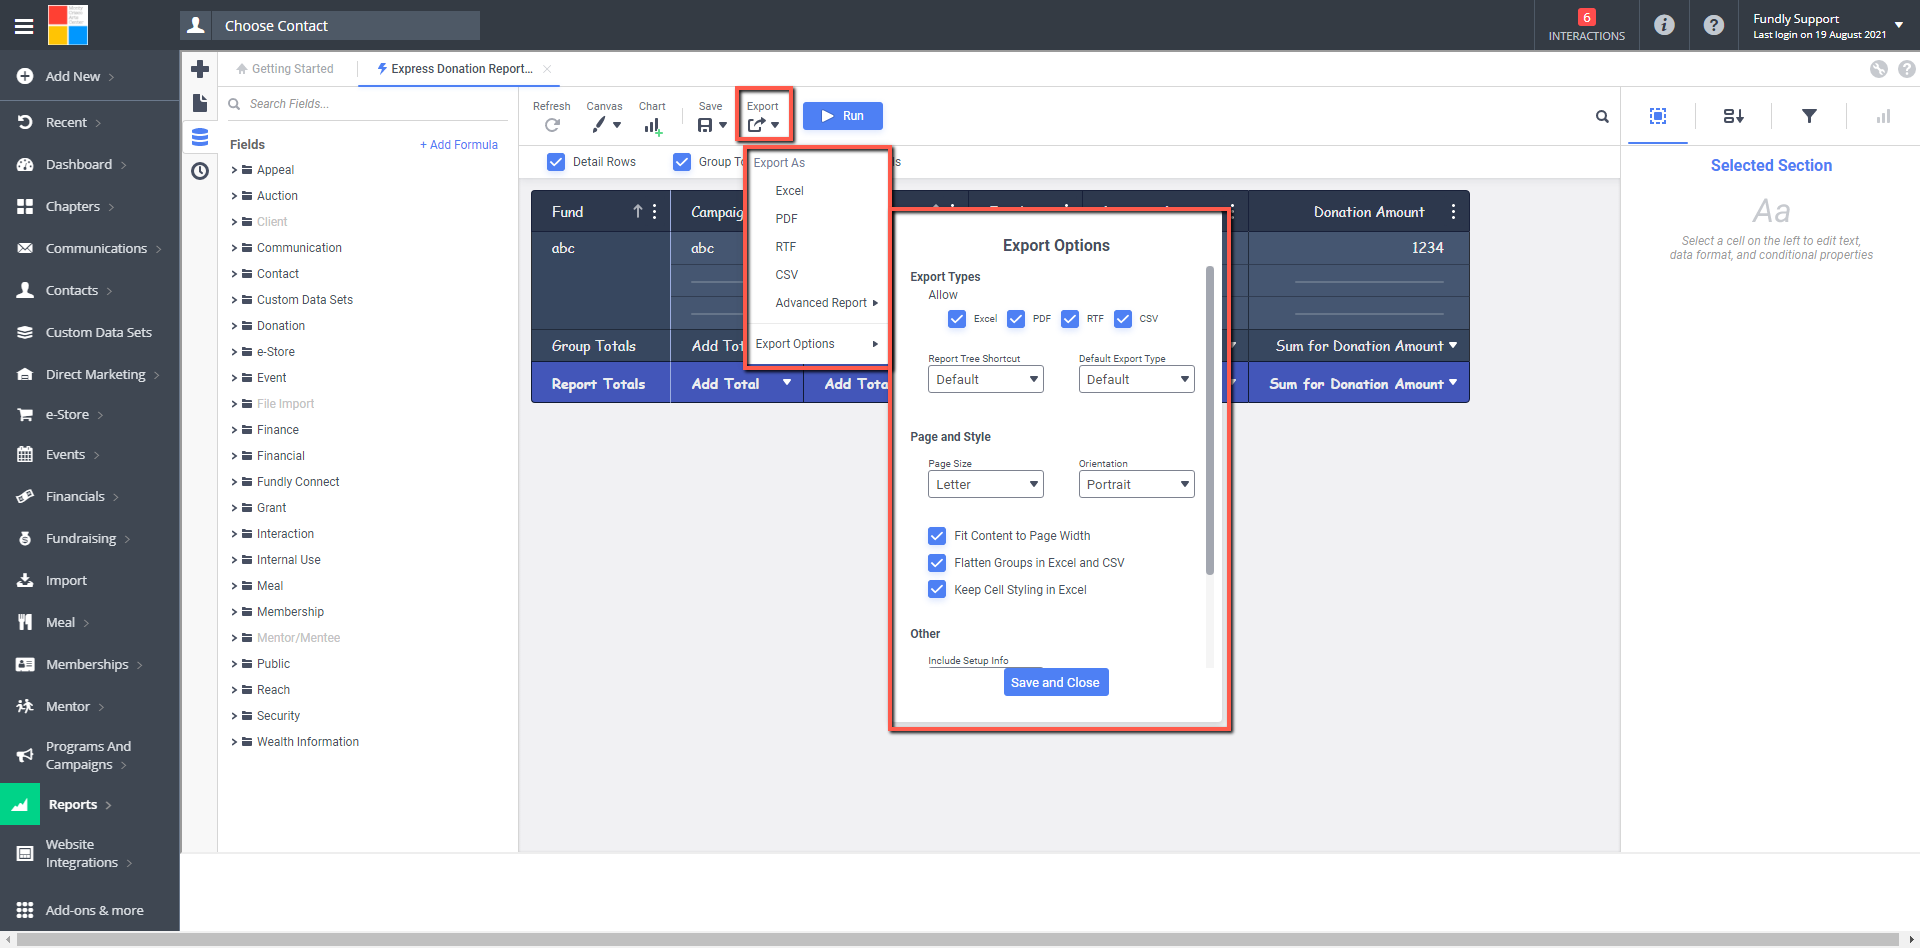
- Additionally, you can control the layout settings that control how the report appears when exported/printed in all of the various custom reporting formats. For instance, you can set the report to be restricted to 1 page, be oriented landscape or portrait, and set the default export format.
- In Express View reports, these settings are Export option on the toolbar.
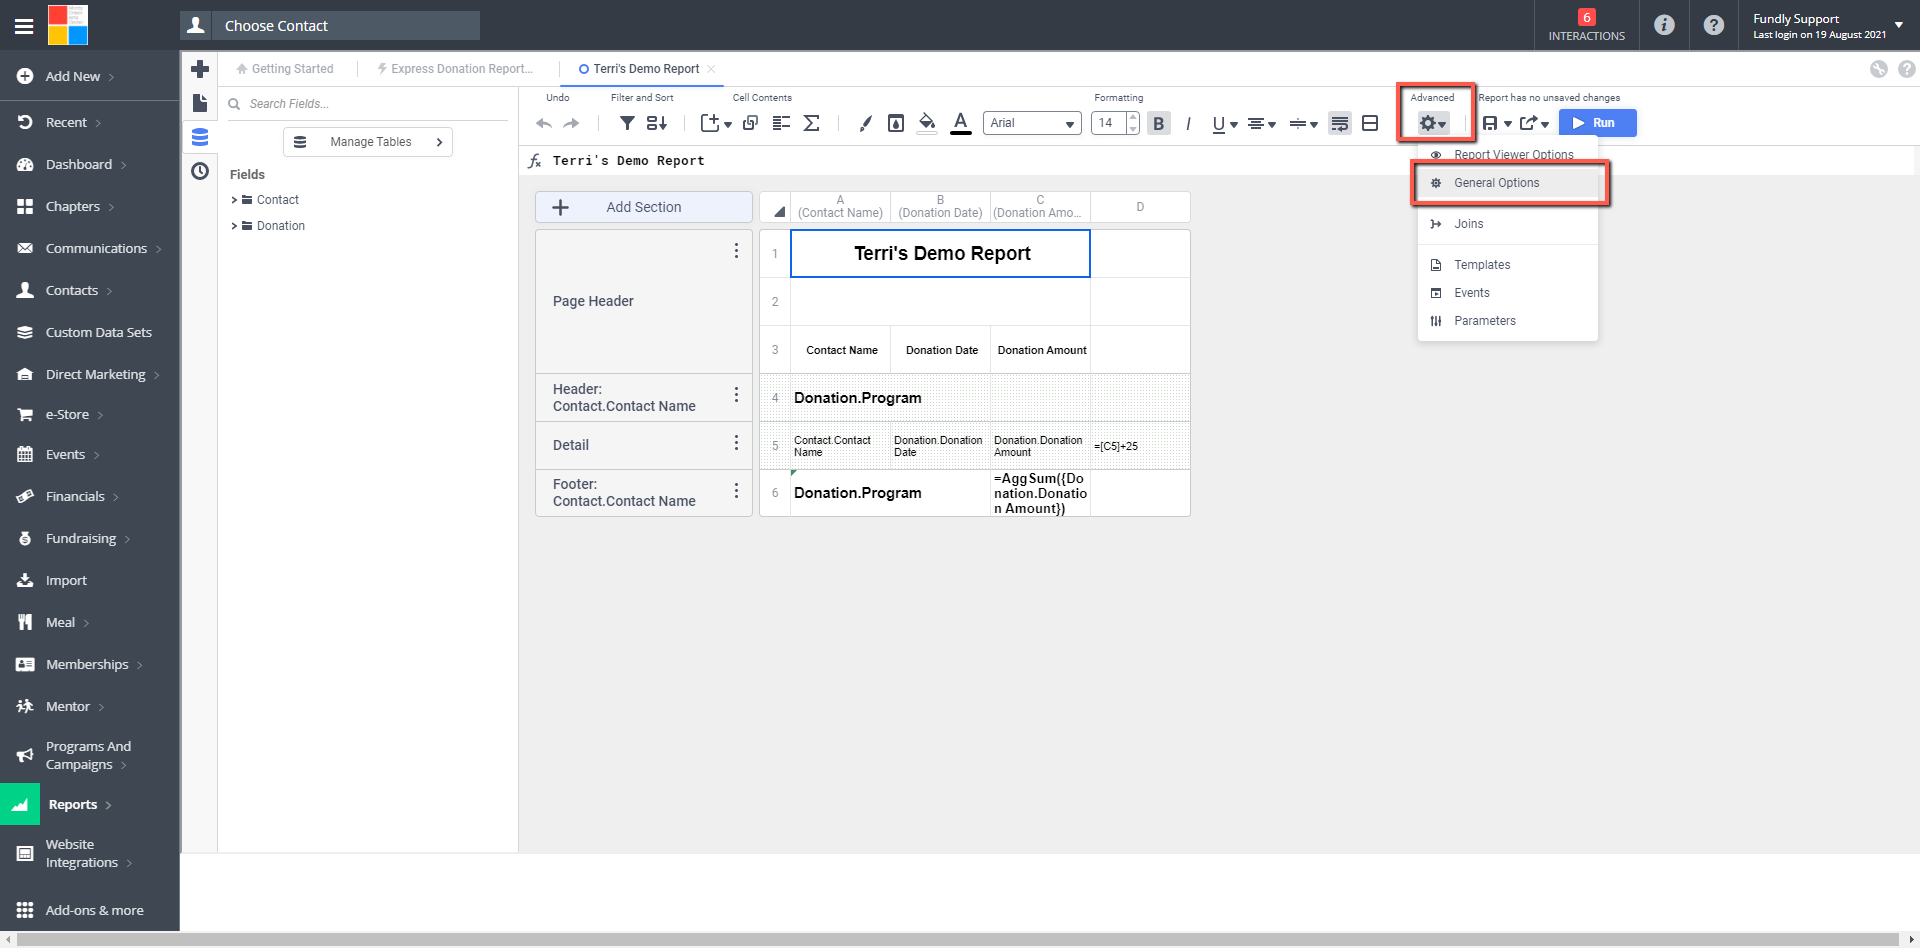
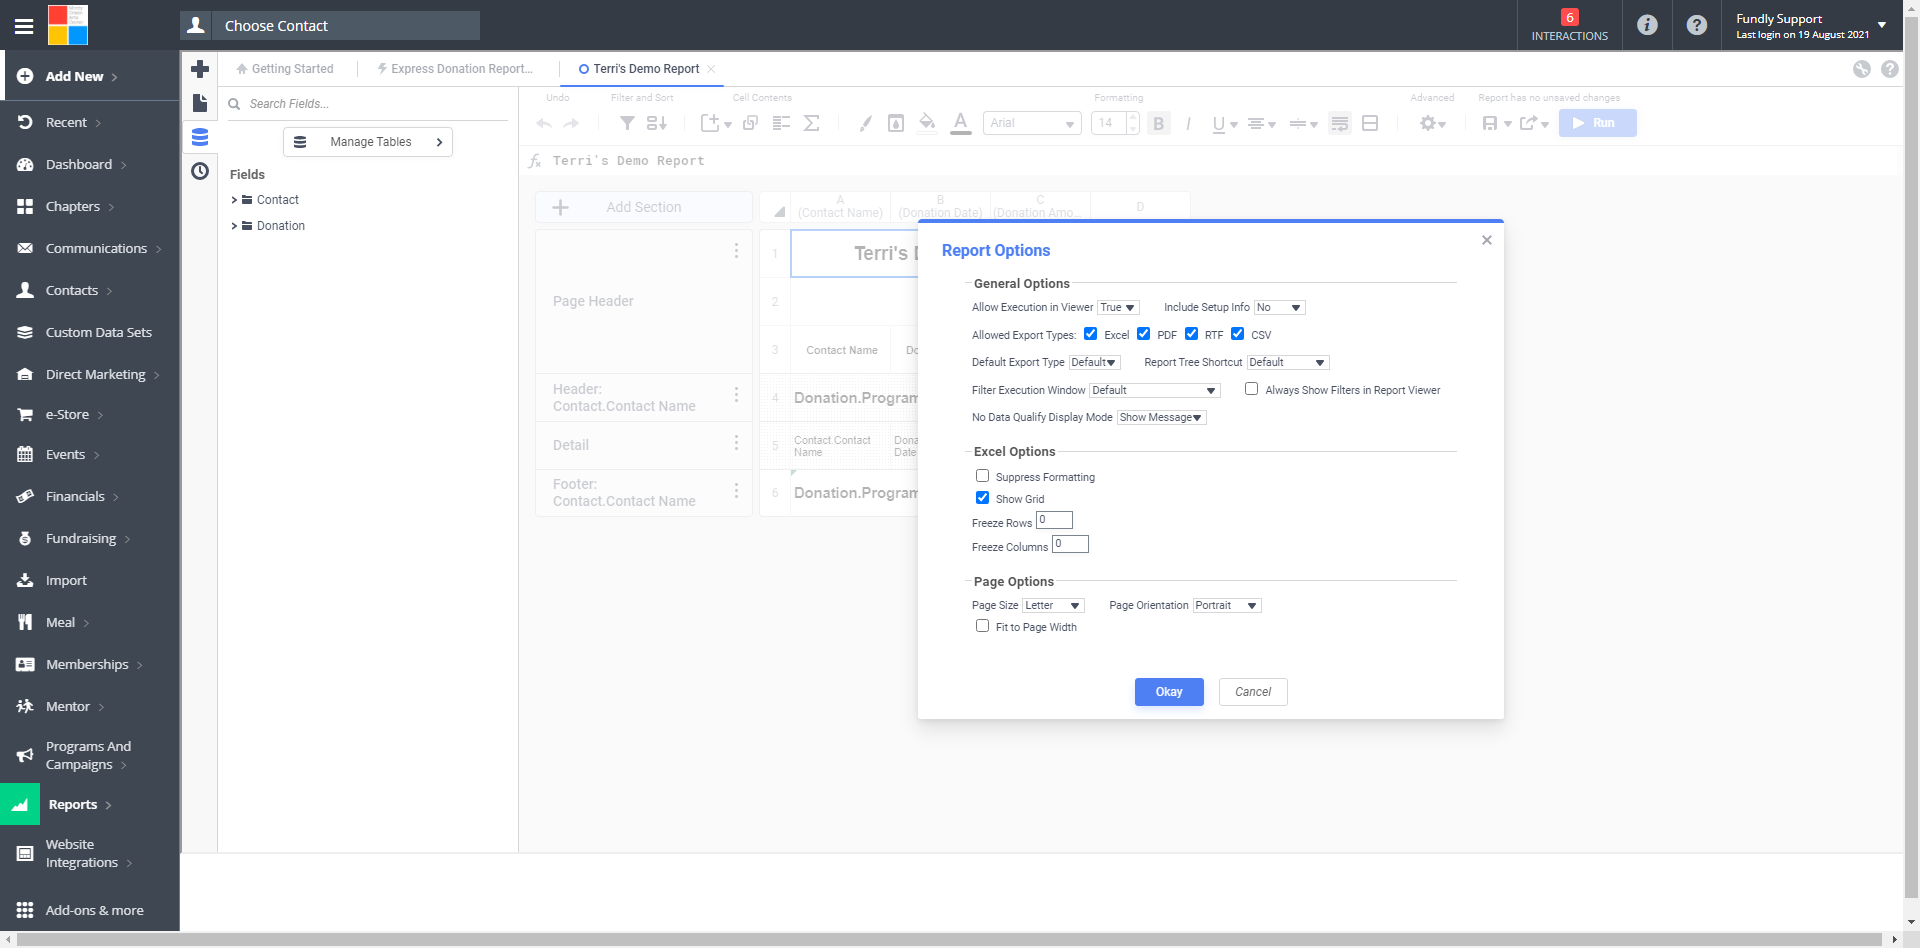
- In Advanced Reports and Cross-Tab Reports, they are on the Advanced menu under Options (select General)
- In Express View reports, these settings are Export option on the toolbar.
- There are also a variety of formulas/functions that will allow you to customize the report appearance by adding your organization's logo to the report, to display the filters that have been applied to a report, and display the date and time the report was run. We have separate tutorials in the support library that cover how to accomplish these various tasks.
- There is an unlimited number of ways to format your reports to make them attractive inside Fundly CRM. Add borders, alternate row shading, font colors, add images, add a chart or graph, and more. Almost anything you can envision, you can do!
Comments
0 comments
Article is closed for comments.