Basic Reporting Part IIIc: Creating Custom Reports Using Cross-Tab Reports
NOTE: Due to a recent update to the reporting module, you may notice some differences between your system and the screenshots in this tutorial. We are working to update the screenshots, but in the meantime, the steps in the tutorial below are accurate/have not changed.
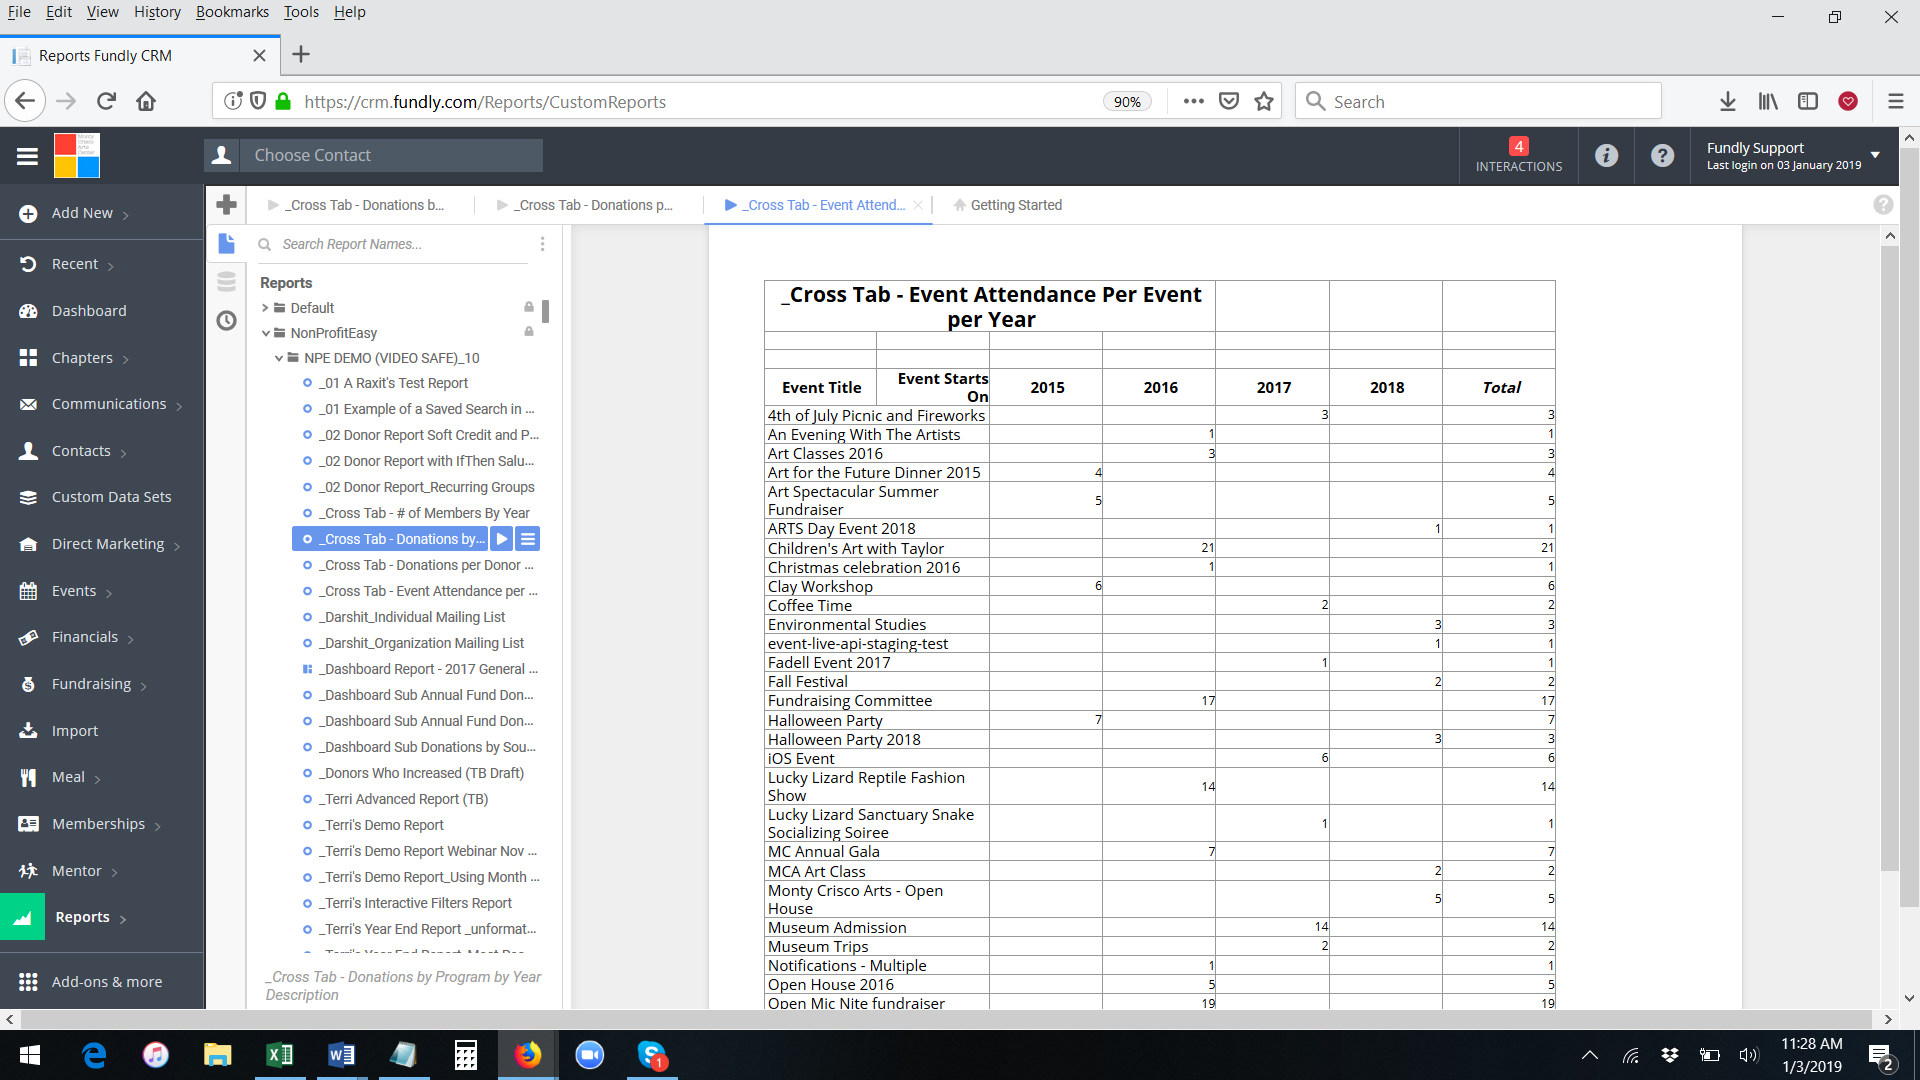
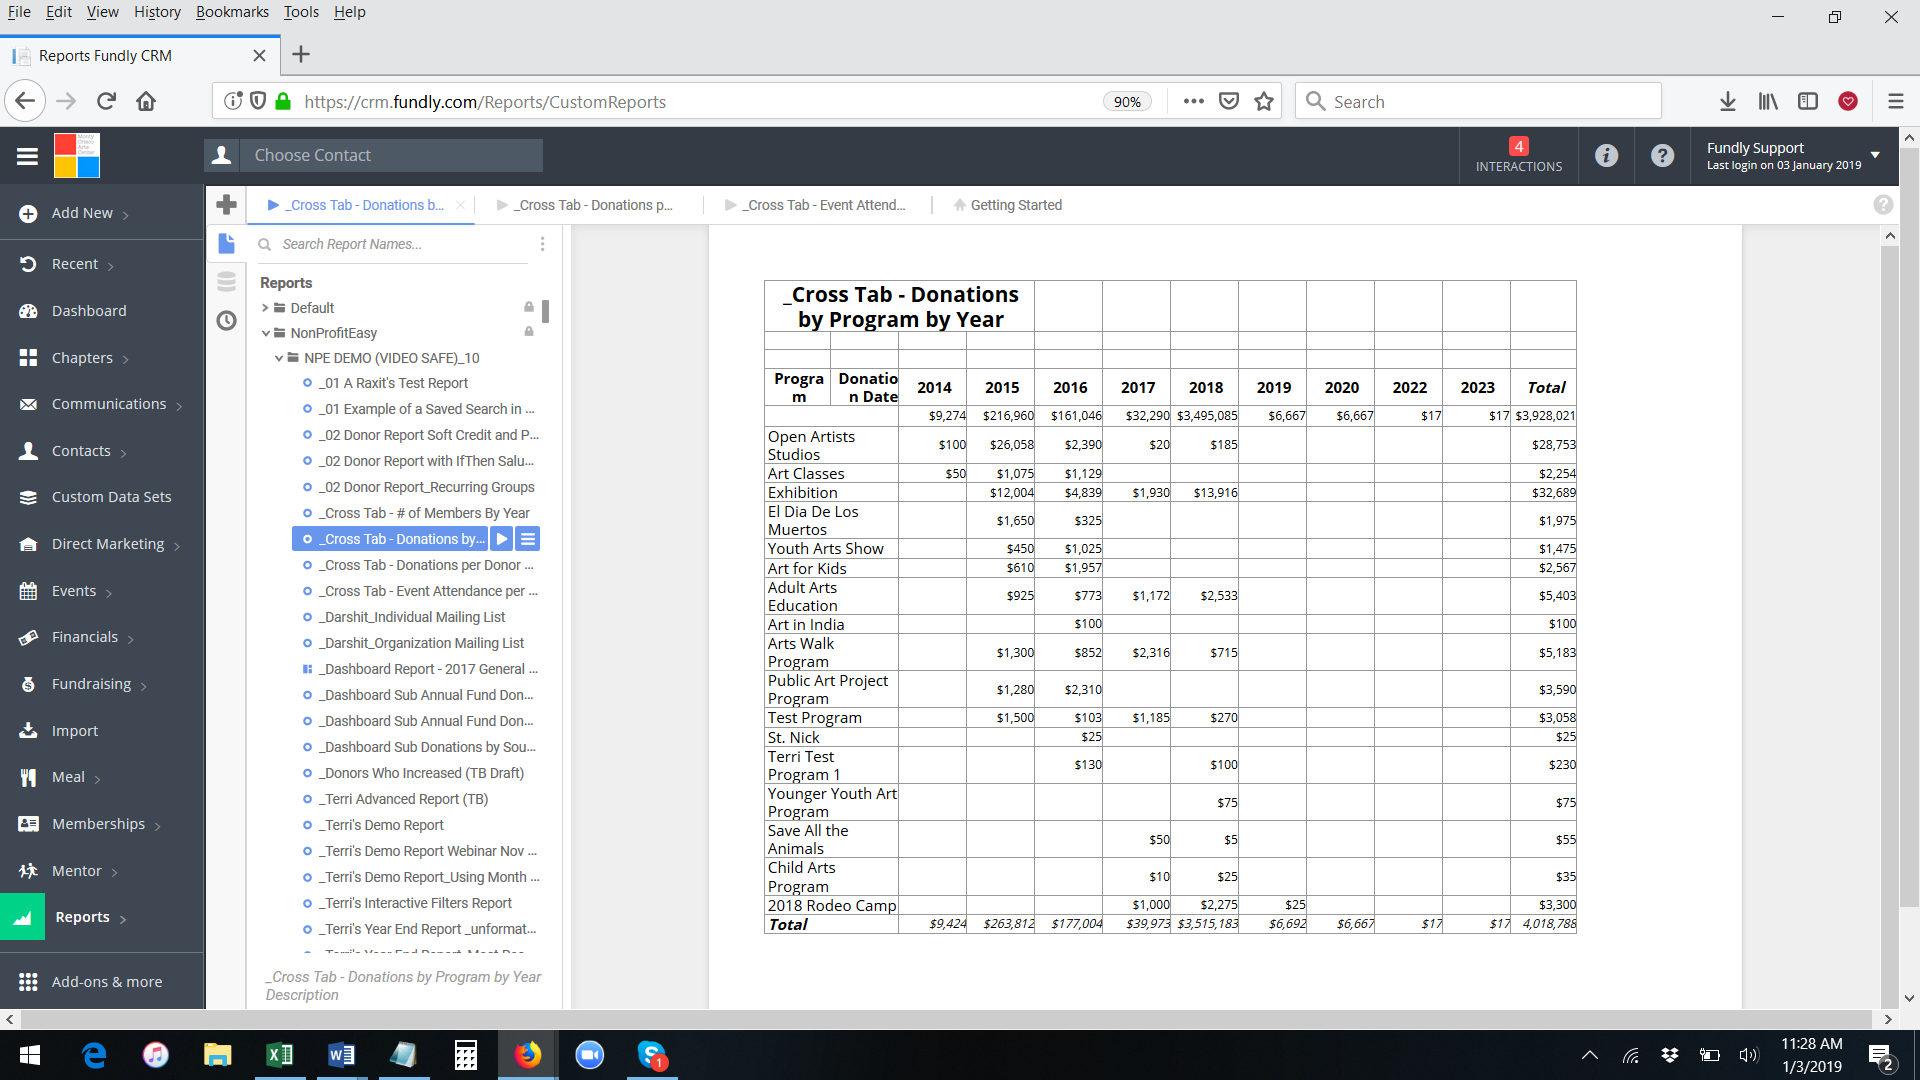
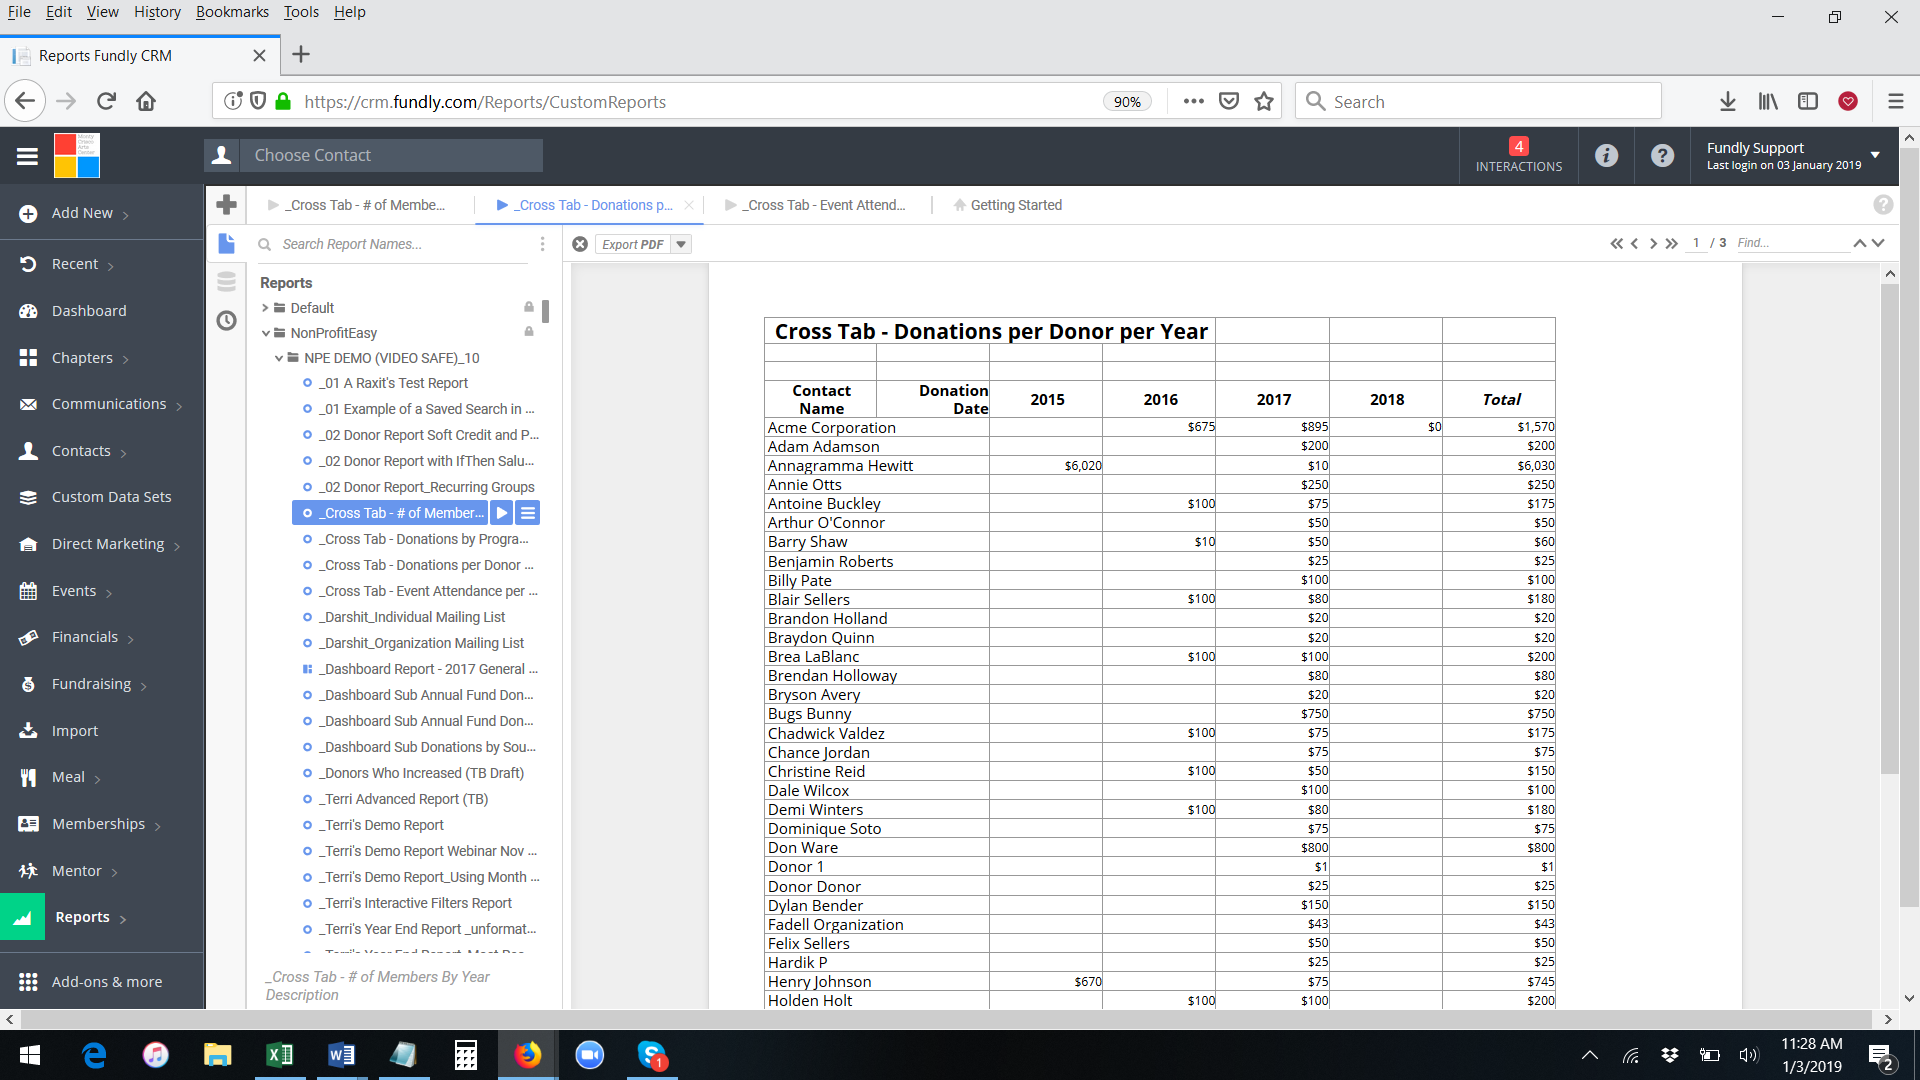
- Cross-Tab reports are matrix-style reports, akin to Pivot Tables in Excel. They can be used to tabulate things like Total Donations per Donor (or donation source or campaign or program) per year (or month or quarter), Total # of Memberships per Membership Level Per Year or Average Number of Volunteers per Volunteer Activity per year. Pictured below are three different Cross-Tab examples.
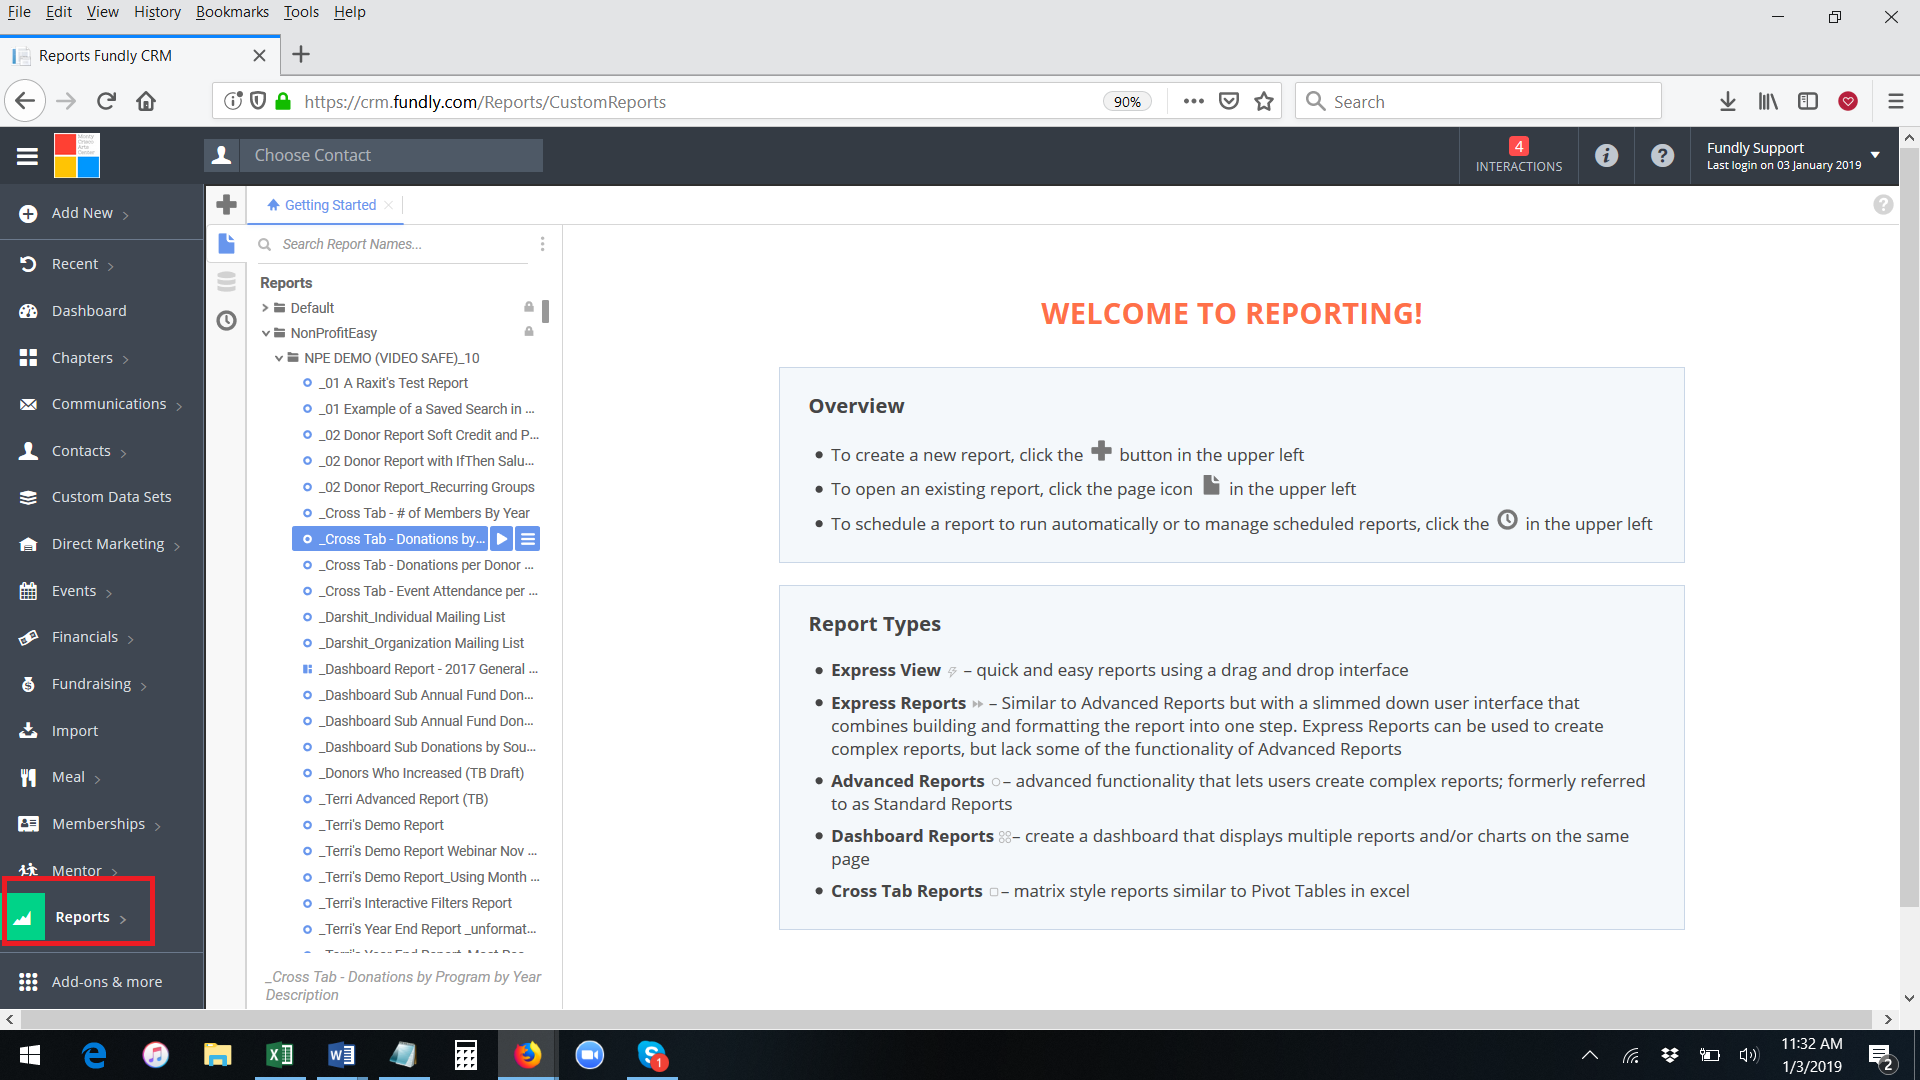
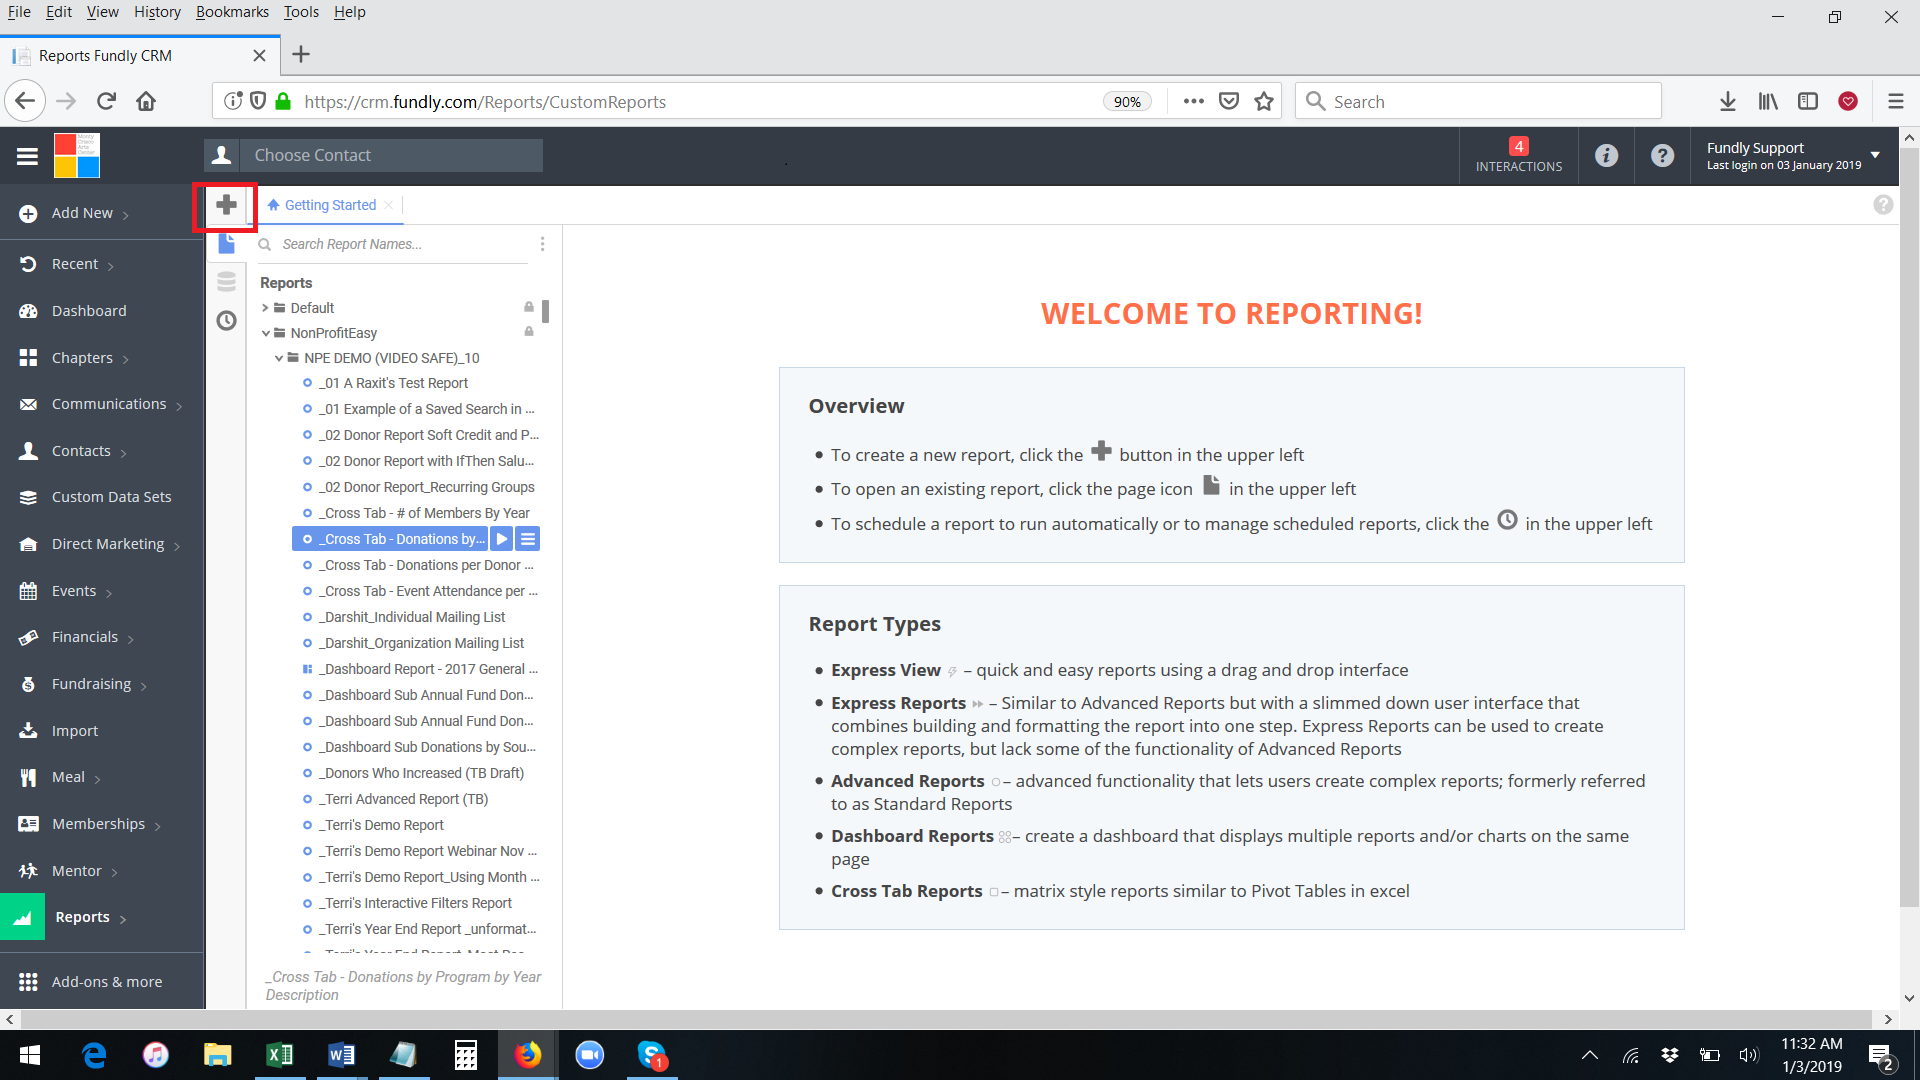
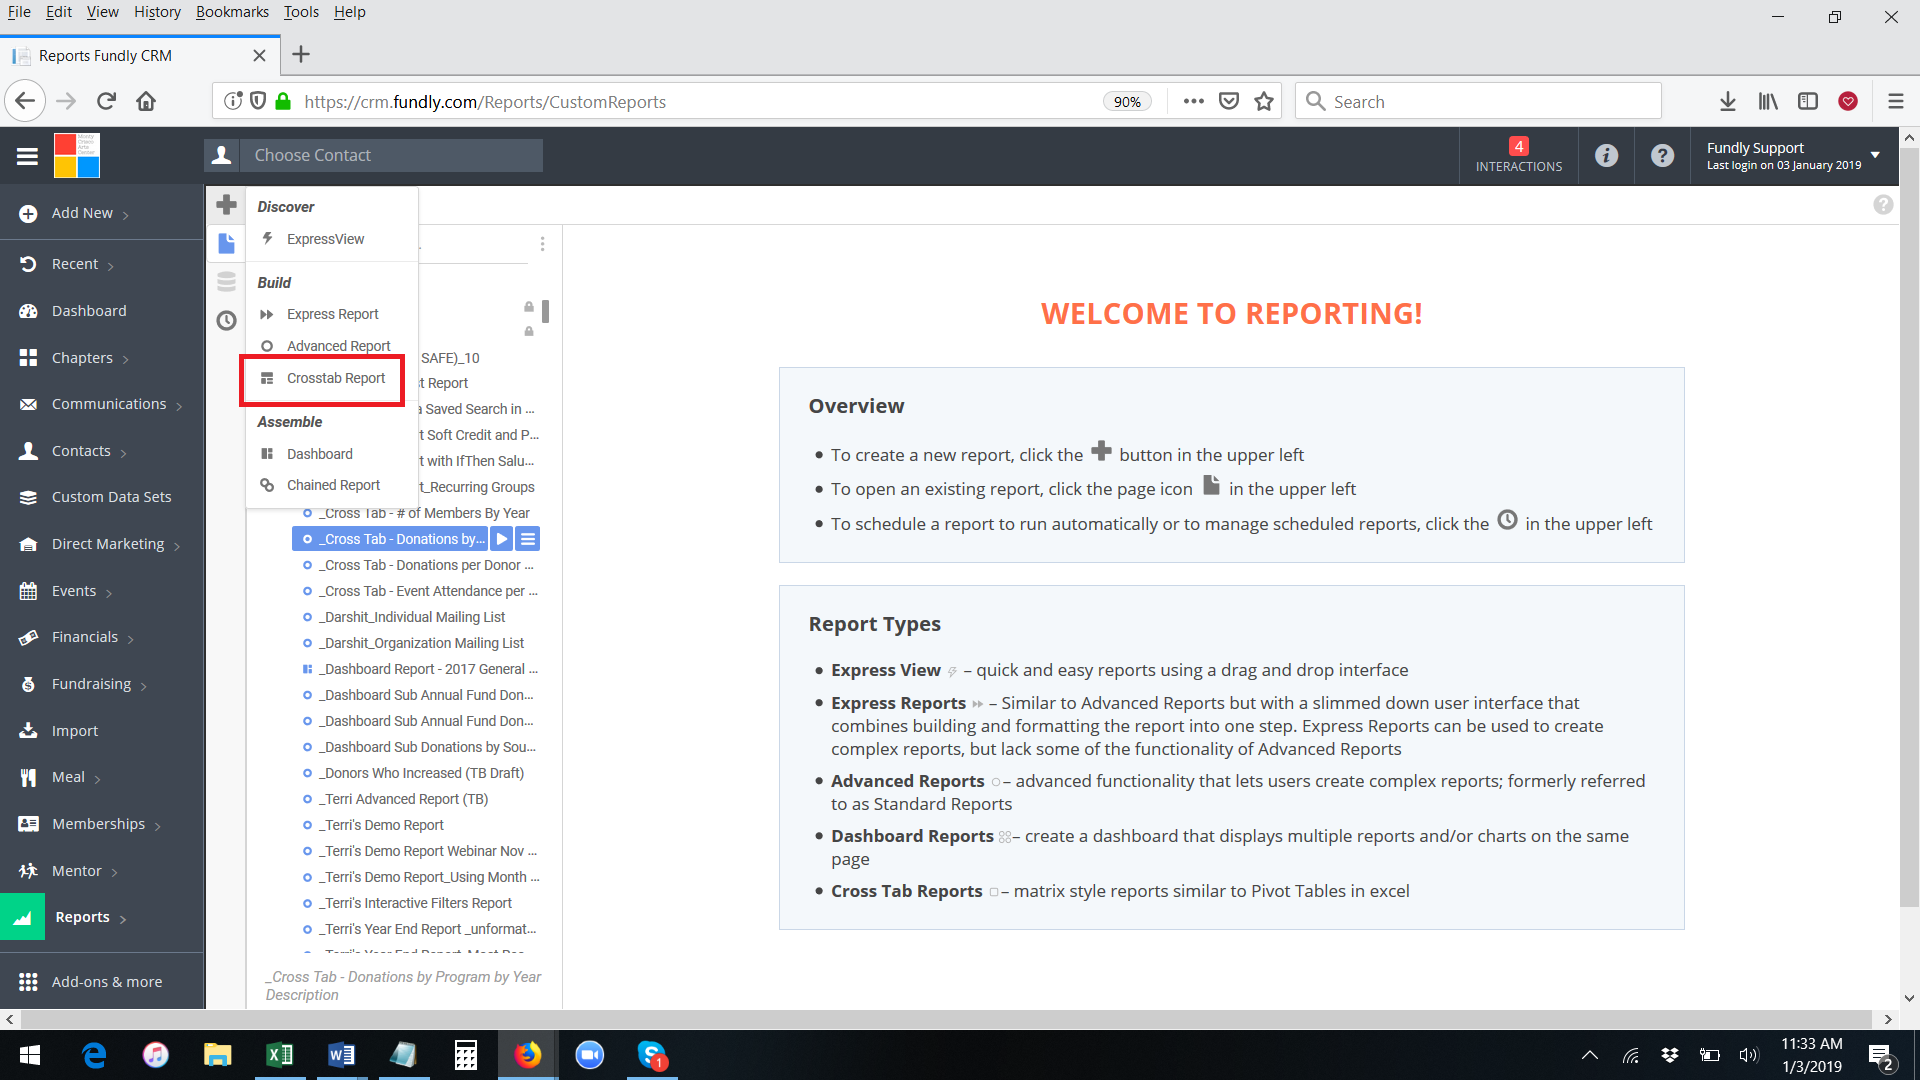
- Cross-Tab reports can be created from the Reports Index Page (Main Menu: Reports). Click the + sign in the upper left and select Crosstab Report
- A video tutorial on creating a cross-tab report is below. Complete Written Step-by-Step Tutorial for creating a cross-tab report is in the Exago Support Library at: http://support.exagoinc.com/hc/en-us/articles/215237608-CrossTab-Reports
Video Tutorial:
Comments
0 comments
Article is closed for comments.